
West Long Branch, NJ – Vice President Kamala Harris’s entry into the presidential race may have been a game-changer at the time, but there has been little significant movement since then. While Harris continues to hold slightly more support than former President Donald Trump among all voters nationwide, there is more than enough room for the outcome to go either way as a result of very small shifts in turnout. The Monmouth (“Mon-muth”) University Poll finds nearly half of Trump voters are okay with the idea of destabilizing government in order to bring about change. Also, Trump voters are much less likely than Harris voters to express confidence that the election will be conducted fairly and accurately and are more concerned about election meddling.
Just under half of registered voters say they will either definitely (41%) or probably (7%) vote for Harris and, in a separate question, similar numbers will definitely (39%) or probably (6%) support Trump. The “definite” support numbers include voters who have already cast their ballots. About half say they will definitely not vote for Trump (50%), while about the same number definitely will not vote for Harris (48%). One change that has occurred since last month is more voters moving from the probable to definite categories. In September, total candidate support stood at 49% for Harris and 44% for Trump.

“Presidential election polling this fall can best be characterized as stable uncertainty. Major events like an assassination attempt and a high-profile debate barely caused the needle to stutter. Shifts of a single point can be consequential to the outcome but are beyond the ability of most polls to capture with any precision. The bottom line is this race is a toss-up and has been since August,” said Patrick Murray, director of the independent Monmouth University Polling Institute.
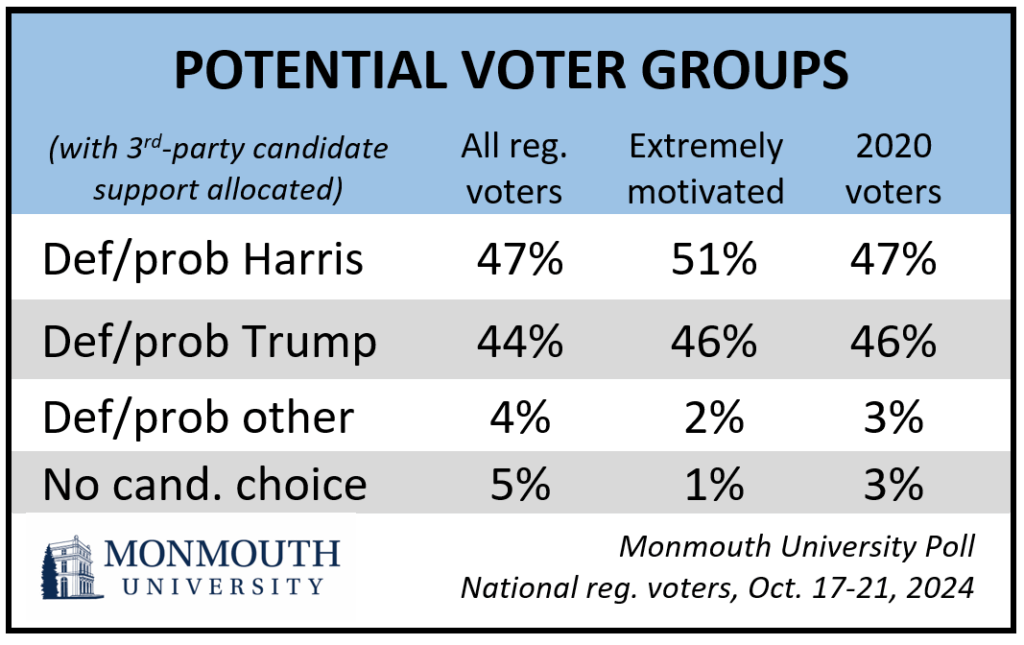
Taking potential third-party support into account knocks a point from the vote share for both nominees, to 47% for Harris and 44% for Trump, with 4% potentially going to other candidates if all registered voters turnout. Trump’s support increases slightly if this year’s electorate is identical to turnout from four years ago – 46% for Trump, 47% for Harris and 3% for other candidates. The picture of the race is a little better for Harris when motivation is used as a potential turnout metric. Voters who describe themselves as extremely motivated to cast a ballot this year represent three-quarters (74%) of all registered voters. Among this group, Harris has 51% support and Trump is backed by 46%, with the third-party vote share dropping to 2%. The proportion of this motivated electorate who are undecided – meaning they do not lean toward any candidate – is only 1%.

Voters remain somewhat more confident in Harris (55%) than Trump (48%) when it comes to possessing the mental and physical stamina necessary to carry out the job, but the gap is not all that large. Just under half are confident that either Harris (46%) or Trump (47%) can bring about the kind of change our country needs, although voters are more likely to be very confident about Trump (37%) than Harris (28%) on this score. A majority of voters (60%) say it is more important to have a stable system of government even if that means not much changes in the country. This compares with 34% who say it is more important to have significant change even if that means our system of government becomes less stable. Harris supporters prefer stability (74%) over change (23%), while Trump backers are split (44% stability and 45% change).
Trump has suggested that he could suspend some laws and constitutional provisions to go after political enemies if he is elected. Voters are divided on whether this is something he will seriously do (48%) or if it is more of an exaggeration (49%). Six in 10 voters (59%) would be bothered a lot if Trump actually did this. Most Trump supporters (77%) view these statements as exaggerations, but only 28% would be bothered a lot if he actually carried them out. Among Harris voters, 78% take these statements seriously and 90% would be bothered a lot if he was elected and followed through on them.
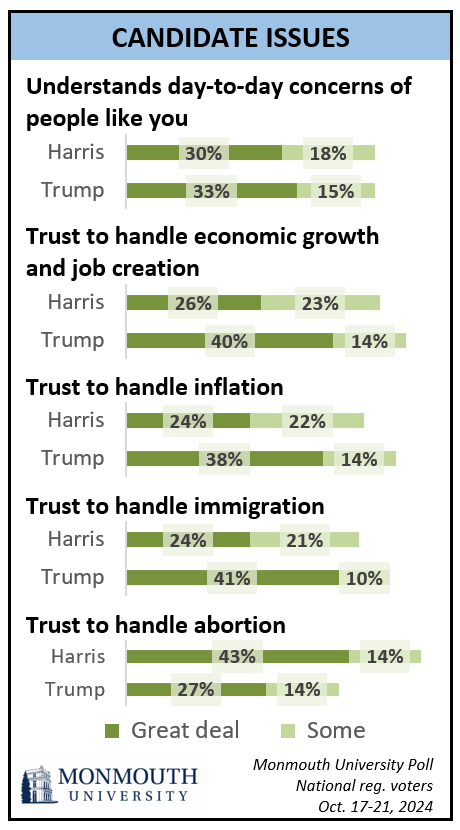
The two candidates run evenly when it comes to being seen as understanding the “day-to-day concerns of people like you” – 48% say this describes Harris either a great deal or some and 48% say the same about Trump. The Democrat had a slight edge on this metric in prior Monmouth polls (49% for Harris to 45% for Trump in September).
Turning to policy areas, the Republican has a small advantage on being trusted to handle economic growth and job creation (54% for Trump and 49% for Harris) as well as inflation (52% for Trump and 46% for Harris). The gap is even wider when focusing on voters who have a great deal of trust in either candidate on these two issues – about 4 in 10 for Trump to about 1 in 4 for Harris.
Trump (51%) holds an advantage over Harris (45%) on being trusted to handle immigration, especially when it comes to having a great deal of trust on this issue (41% for Trump to 24% for Harris). However, Trump’s overall trust level on immigration has declined slightly from last month (56% in September) while trust in Harris has remained stable (45% in September).
The Democrat’s one clear issue advantage is on abortion – 57% trust Harris while 41% trust Trump. There is an even wider margin among those who trust the candidates a great deal (43% Harris to 27% Trump).
The gender gap in the presidential race – 52% of women currently support Harris (42% back Trump) and 50% of men currently support Trump (44% back Harris) – continues to be smaller than the difference in support levels by race and education. Among white voters without a college degree, Trump has a 60% vote share and Harris has 36% support. Harris holds more support than Trump among white college graduates (56% to 38%) as well as voters who are Black, Hispanic, Asian, or of another racial identity (60% to 28%).
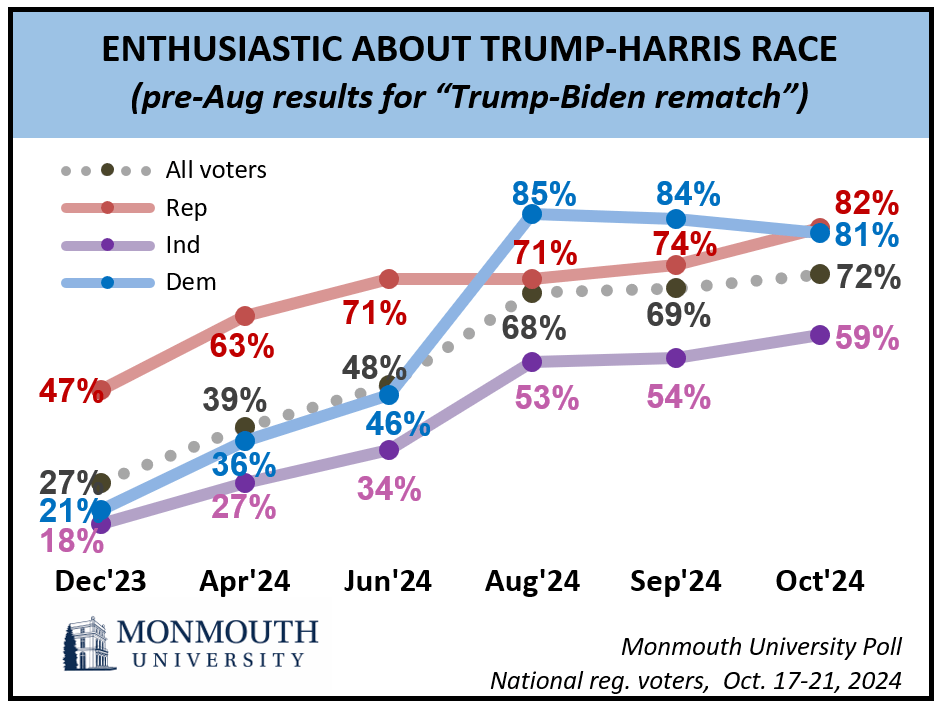
The jump in voter enthusiasm that occurred when Harris replaced President Joe Biden as the Democratic candidate remains, but with a slight partisan flip. Overall, 72% of voters are either very or somewhat enthusiastic about the Harris-Trump race, which is similar to levels in September (69%). Enthusiasm has increased among Republicans since last month (from 74% to 82%), while it has dipped slightly among Democrats (from 84% to 81%).
In other poll findings, 66% of voters are at least somewhat confident that the 2024 election will be conducted fairly and accurately. This includes 87% of Harris voters, but only 44% of Trump supporters. In the prior presidential election, a similar number of voters was confident in the fair and accurate conduct of that year’s election (60% in late September 2020), but there was a much smaller gap between Biden voters (69%) and Trump voters (49%). Currently, nearly three-quarters (73%) of voters are at least somewhat concerned about the possibility that election meddling could undermine the integrity of the 2024 results. Trump voters (85%) are much more likely than Harris voters (64%) to be concerned about this. In 2020, there was little difference in the levels of concern about election meddling between Trump (83%) and Biden (80%) voters.
“We are seeing news reports about election meddling efforts coming from both inside and outside of our country. I don’t know why, but some Democrats have taken their eye off this ball,” said Murray.
On the generic congressional ballot, 47% of voters currently support the Democratic congressional candidate in their U.S. House district, while 45% back the Republican. This result is not statistically different from prior Monmouth polls this year. Among extremely motived voters, Democrats currently have a negligible 50% to 47% edge over Republicans for the House, while among the 2020 electorate, voter support is evenly divided between Democrats (47%) and Republicans (47%).
The Monmouth University Poll was conducted by telephone and online from October 17 to 21, 2024 with 802 registered voters in the United States. The question results in this release have a margin of error +/- 4.1 percentage points. The poll was conducted by the Monmouth University Polling Institute in West Long Branch, NJ.
QUESTIONS AND RESULTS
(* Some columns may not add to 100% due to rounding.)
1.How motivated are you to vote in the election for president – extremely motivated, very motivated, somewhat motivated, or not motivated?
| Trend: Registered voters | Oct. 2024 | Sept. 2024 | Aug. 2024 |
|---|---|---|---|
| Extremely motivated | 74% | 70% | 66% |
| Very motivated | 11% | 15% | 14% |
| Somewhat motivated | 8% | 11% | 12% |
| Not motivated | 5% | 4% | 7% |
| (VOL) Don’t know | 1% | 0% | 0% |
| (n) | (802) | (803) | (801) |
2.How will you vote this year – in person on Election Day, in person at an early voting location, by mail ballot, have you already voted, or won’t you vote at all?
| Registered voters | Oct. 2024 |
|---|---|
| In person on Election Day | 39% |
| In person at an early voting location | 24% |
| By mail ballot | 20% |
| Already voted * | 12% |
| Won’t vote at all | 3% |
| (VOL) Don’t know | 3% |
| (n) | (802) |
[QUESTIONS 3 & 4 WERE ROTATED]
Looking ahead to the November election…
3.How likely are you to vote for Donald Trump in the election for president – will you definitely vote for him, probably vote for him, probably not vote for him, or definitely not vote for him?
| Trend: Registered voters | Oct. 2024 | Sept. 2024 | Aug. 2024 | Comparison: In election against Biden | June 2024 | April 2024 | Feb. 2024 | Dec. 2023 | Sept. 2023 | July 2023 | May 2023 |
|---|---|---|---|---|---|---|---|---|---|---|---|
| Definitely (or already voted for him) | 39% | 34% | 33% | 32% | 30% | 30% | 29% | 31% | 26% | 29% | |
| Probably | 6% | 10% | 10% | 12% | 14% | 16% | 13% | 12% | 14% | 12% | |
| Probably not | 5% | 5% | 6% | 5% | 6% | 6% | 8% | 8% | 8% | 8% | |
| Definitely not (or already voted for someone else) | 50% | 48% | 49% | 49% | 48% | 47% | 48% | 48% | 50% | 46% | |
| (VOL) Don’t know | 1% | 3% | 2% | 2% | 2% | 1% | 2% | 1% | 1% | 4% | |
| (n) | (802) | (803) | (801) | (1,034) | (746) | (822) | (743) | (737) | (840) | (907) |
4.How likely are you to vote for Kamala Harris in the election for president – will you definitely vote for her, probably vote for her, probably not vote for her, or definitely not vote for her?
| Trend: Registered voters | Oct. 2024 | Sept. 2024 | Aug. 2024 | Comparison: Likely to vote for Biden | June 2024 | April 2024 | Feb. 2024 | Dec. 2023 | Sept. 2023 | July 2023 | May 2023 |
|---|---|---|---|---|---|---|---|---|---|---|---|
| Definitely (or already voted for her) | 41% | 39% | 38% | 31% | 32% | 30% | 31% | 31% | 36% | 32% | |
| Probably | 7% | 10% | 10% | 12% | 11% | 14% | 11% | 11% | 11% | 13% | |
| Probably not | 3% | 6% | 6% | 6% | 6% | 7% | 7% | 6% | 6% | 7% | |
| Definitely not (or already voted for someone else) | 48% | 42% | 44% | 49% | 49% | 48% | 49% | 51% | 46% | 45% | |
| (VOL) Don’t know | 1% | 3% | 2% | 1% | 2% | 1% | 1% | 1% | 1% | 3% | |
| (n) | (802) | (803) | (801) | (1,034) | (746) | (822) | (743) | (737) | (840) | (907) |
5.How likely are you to vote for one of the third party candidates for president such as Chase Oliver the Libertarian candidate or Jill Stein the Green Party candidate – will you definitely vote for a third party candidate, probably vote third party, probably not vote third party, or definitely not vote for a third party candidate?
| Trend: Registered voters | Oct. 2024 | Sept. 2024 |
|---|---|---|
| Definitely (or already voted for third party) | 2% | 1% |
| Probably | 2% | 3% |
| Probably not | 12% | 18% |
| Definitely not (or already voted for someone else) | 81% | 73% |
| (VOL) Don’t know | 3% | 5% |
| (n) | (802) | (803) |
6.If the election for U.S. House of Representatives was held today, would you vote for the Republican or the Democratic candidate in your Congressional district? [PARTIES WERE ROTATED] [If UNDECIDED:] At this time do you lean more toward the Republican or more toward the Democratic candidate? [Includes those who already voted.]
| Trend: Registered voters | Oct. 2024 | Sept. 2024 | Aug. 2024 | June 2024 |
|---|---|---|---|---|
| Republican | 45% | 47% | 46% | 48% |
| Democrat | 47% | 48% | 48% | 45% |
| (VOL) Neither/Another candidate | 6% | 1% | 4% | 5% |
| (VOL) Don’t know | 2% | 4% | 2% | 2% |
| (n) | (802) | (803) | (801) | (1,034) |
7.How do you feel about the upcoming election between Kamala Harris and Donald Trump – are you very enthusiastic, somewhat enthusiastic, not too enthusiastic, or not at all enthusiastic? [NAMES WERE ROTATED]
| Trend: Registered voters | Oct. 2024 | Sept. 2024 | Aug. 2024 | Comparison: Biden/Trump Race | June 2024* | April 2024* | Dec. 2023* |
|---|---|---|---|---|---|---|---|
| Very enthusiastic | 49% | 41% | 45% | 26% | 20% | 14% | |
| Somewhat enthusiastic | 23% | 28% | 23% | 22% | 19% | 13% | |
| Not too enthusiastic | 11% | 15% | 15% | 18% | 22% | 20% | |
| Not at all enthusiastic | 14% | 15% | 15% | 32% | 38% | 49% | |
| (VOL) Don’t know | 3% | 2% | 2% | 2% | 1% | 3% | |
| (n) | (802) | (803) | (801) | (1,034) | (746) | (743) |
[QUESTIONS 8 & 9 WERE ROTATED]
8.How much does Donald Trump understand the day to day concerns of people like you – a great deal, some, not much, or not at all?
| Trend: Registered voters | Oct. 2024 | Sept. 2024 | Aug. 2024 |
|---|---|---|---|
| Great deal | 33% | 29% | 30% |
| Some | 15% | 16% | 14% |
| Not much | 6% | 10% | 9% |
| Not at all | 46% | 44% | 46% |
| (VOL) Don’t know | 1% | 1% | 1% |
| (n) | (802) | (803) | (801) |
9.How much does Kamala Harris understand the day to day concerns of people like you – a great deal, some, not much, or not at all?
| Trend: Registered voters | Oct. 2024 | Sept. 2024 | Aug. 2024 |
|---|---|---|---|
| Great deal | 30% | 26% | 28% |
| Some | 18% | 23% | 21% |
| Not much | 10% | 12% | 10% |
| Not at all | 40% | 38% | 39% |
| (VOL) Don’t know | 2% | 1% | 1% |
| (n) | (802) | (803) | (801) |
[QUESTIONS 10 & 11 WERE ROTATED]
10.How confident are you that Donald Trump has the mental and physical stamina necessary to carry out the job of president – very confident, somewhat confident, not too confident, or not at all confident?
| Trend: Registered voters | Oct. 2024 | Sept. 2024 | Aug. 2024 | Feb. 2024 | June 2020 |
|---|---|---|---|---|---|
| Very confident | 38% | 36% | 38% | 36% | 33% |
| Somewhat confident | 10% | 14% | 9% | 15% | 12% |
| Not too confident | 7% | 8% | 7% | 10% | 11% |
| Not at all confident | 44% | 42% | 44% | 38% | 43% |
| (VOL) Don’t know | 0% | 1% | 2% | 1% | 1% |
| (n) | (802) | (803) | (801) | (822) | (733) |
11.How confident are you that Kamala Harris has the mental and physical stamina necessary to carry out the job of president – very confident, somewhat confident, not too confident, or not at all confident?
| Trend: Registered voters | Oct. 2024 | Sept. 2024 | Aug. 2024 | Comparison: Biden | Feb. 2024 | June 2020 |
|---|---|---|---|---|---|---|
| Very confident | 43% | 45% | 42% | 12% | 23% | |
| Somewhat confident | 12% | 13% | 15% | 20% | 29% | |
| Not too confident | 9% | 12% | 8% | 15% | 11% | |
| Not at all confident | 35% | 29% | 33% | 52% | 34% | |
| (VOL) Don’t know | 1% | 1% | 2% | 1% | 3% | |
| (n) | (802) | (803) | (801) | (822) | (733) |
[QUESTIONS 12 & 13 WERE ROTATED]
12.How confident are you that Donald Trump would bring about the kind of change our country needs – very confident, somewhat confident, not too confident, or not at all confident?
| Trend: Registered voters | Oct. 2024 | Aug. 2024 |
|---|---|---|
| Very confident | 37% | 33% |
| Somewhat confident | 10% | 13% |
| Not too confident | 7% | 6% |
| Not at all confident | 46% | 49% |
| (VOL) Don’t know | 1% | 0% |
| (n) | (802) | (801) |
13.How confident are you that Kamala Harris would bring about the kind of change our country needs – very confident, somewhat confident, not too confident, or not at all confident?
| Trend: Registered voters | Oct. 2024 | Aug. 2024 |
|---|---|---|
| Very confident | 28% | 24% |
| Somewhat confident | 18% | 21% |
| Not too confident | 10% | 8% |
| Not at all confident | 43% | 46% |
| (VOL) Don’t know | 2% | 0% |
| (n) | (802) | (801) |
14.Which is more important to you: to have a stable system of government even if that means not much changes in the country, or to have significant change in the country even if that means our system of government becomes less stable? [ITEMS WERE ROTATED]
| Trend: Registered voters | Oct. 2024 | June 2024 |
|---|---|---|
| Stable system | 60% | 57% |
| Significant change | 34% | 37% |
| (VOL) Don’t know | 6% | 6% |
| (n) | (802) | (1,034) |
[QUESTIONS 15 & 16 WERE ROTATED]
15.How much do you trust Donald Trump to handle the issue of immigration – a great deal, some, not much, or not at all?
| Trend: Registered voters | Oct. 2024 | Sept. 2024 |
|---|---|---|
| Great deal | 41% | 43% |
| Some | 10% | 13% |
| Not much | 9% | 8% |
| Not at all | 39% | 36% |
| (VOL) Don’t know | 1% | 0% |
| (n) | (802) | (803) |
16.How much do you trust Kamala Harris to handle the issue of immigration – a great deal, some, not much, or not at all?
| Trend: Registered voters | Oct. 2024 | Sept. 2024 |
|---|---|---|
| Great deal | 24% | 21% |
| Some | 21% | 24% |
| Not much | 9% | 9% |
| Not at all | 46% | 45% |
| (VOL) Don’t know | 0% | 1% |
| (n) | (802) | (803) |
[QUESTIONS 17 & 18 WERE ROTATED]
17.How much do you trust Donald Trump to handle the issue of abortion – a great deal, some, not much, or not at all?
| Trend: Registered voters | Oct. 2024 | Sept. 2024 |
|---|---|---|
| Great deal | 27% | 27% |
| Some | 14% | 16% |
| Not much | 8% | 9% |
| Not at all | 48% | 45% |
| (VOL) Don’t know | 3% | 3% |
| (n) | (802) | (803) |
18.How much do you trust Kamala Harris to handle the issue of abortion – a great deal, some, not much, or not at all?
| Trend: Registered voters | Oct. 2024 | Sept. 2024 |
|---|---|---|
| Great deal | 43% | 45% |
| Some | 14% | 15% |
| Not much | 8% | 9% |
| Not at all | 32% | 27% |
| (VOL) Don’t know | 3% | 3% |
| (n) | (802) | (803) |
[QUESTIONS 19 & 20 WERE ROTATED]
19.How much do you trust Donald Trump to handle the issue of inflation – a great deal, some, not much, or not at all?
| Registered voters | Oct. 2024 |
|---|---|
| Great deal | 38% |
| Some | 14% |
| Not much | 9% |
| Not at all | 38% |
| (VOL) Don’t know | 2% |
| (n) | (802) |
20.How much do you trust Kamala Harris to handle the issue of inflation – a great deal, some, not much, or not at all?
| Registered voters | Oct. 2024 |
|---|---|
| Great deal | 24% |
| Some | 22% |
| Not much | 8% |
| Not at all | 43% |
| (VOL) Don’t know | 3% |
| (n) | (802) |
[QUESTIONS 21 & 22 WERE ROTATED]
21.How much do you trust Donald Trump to handle the issue of economic growth and job creation – a great deal, some, not much, or not at all?
| Registered voters | Oct. 2024 |
|---|---|
| Great deal | 40% |
| Some | 14% |
| Not much | 12% |
| Not at all | 33% |
| (VOL) Don’t know | 1% |
| (n) | (802) |
22.How much do you trust Kamala Harris to handle the issue of economic growth and job creation – a great deal, some, not much, or not at all?
| Registered voters | Oct. 2024 |
|---|---|
| Great deal | 26% |
| Some | 23% |
| Not much | 12% |
| Not at all | 38% |
| (VOL) Don’t know | 1% |
| (n) | (802) |
Thinking about the election in general…
23.How confident are you that the 2024 election will be conducted fairly and accurately – very confident, somewhat confident, not too confident, or not at all confident?
| Trend: Registered voters | Oct. 2024 | Sept. 2024 | Comparison: 2020 Election | Late Sept. 2020 | Early Sept. 2020 | Aug. 2020 |
|---|---|---|---|---|---|---|
| Very confident | 34% | 37% | 24% | 22% | 21% | |
| Somewhat confident | 32% | 32% | 36% | 39% | 42% | |
| Not too confident | 25% | 20% | 27% | 24% | 24% | |
| Not at all confident | 8% | 11% | 12% | 13% | 12% | |
| (VOL) Don’t know | 1% | 0% | 1% | 1% | 1% | |
| (n) | (802) | (803) | (809) | (758) | (785) |
24.How concerned are you about the possibility that election meddling could undermine the integrity of the results – very concerned, somewhat concerned, not too concerned, or not at all concerned?
| Registered voters | Oct. 2024 | Comparison: 2020 Election | Late Sept. 2020 | Aug. 2020 |
|---|---|---|---|---|
| Very concerned | 32% | 42% | 37% | |
| Somewhat concerned | 41% | 38% | 35% | |
| Not too concerned | 15% | 12% | 16% | |
| Not at all concerned | 11% | 7% | 10% | |
| (VOL) Don’t know | 1% | 1% | 1% | |
| (n) | (802) | (809) | (785) |
25.Did you vote in the 2020 presidential election, or did you not vote for whatever reason? [If YES:] Who did you vote for – Donald Trump, Joe Biden, or another candidate? [NAMES WERE ROTATED]
| Trend: Registered voters | Oct. 2024 | Sept. 2024 | Aug. 2024 | June 2024 | April 2024 | Feb. 2024 | Dec. 2023 |
|---|---|---|---|---|---|---|---|
| Donald Trump | 38% | 39% | 38% | 40% | 40% | 41% | 40% |
| Joe Biden | 41% | 41% | 42% | 46% | 45% | 46% | 45% |
| Another candidate | 3% | 3% | 3% | 5% | 4% | 4% | 4% |
| Voted, did not name candidate | 2% | 2% | 2% | 1% | 1% | 2% | 2% |
| Did not vote | 16% | 15% | 15% | 8% | 10% | 7% | 9% |
| (n) | (802) | (803) | (801) | (1,034) | (746) | (822) | (743) |
26.Donald Trump has made statements suggesting that he could suspend some laws and constitutional provisions to go after political enemies if he is elected president again. Do you see these statements as something he will seriously do if elected or more of an exaggeration?
| Trend: Registered voters | Oct. 2024 | June 2024 |
|---|---|---|
| Something he will seriously do | 48% | 52% |
| More of an exaggeration | 49% | 45% |
| (VOL) Don’t know | 4% | 3% |
| (n) | (802) | (1,034) |
27.If Donald Trump did suspend some laws and constitutional provisions if he is elected president, would that bother you a lot, bother you a little, or not bother you at all?
| Trend: Registered voters | Oct. 2024 | June 2024 |
|---|---|---|
| Bother you a lot | 59% | 67% |
| Bother you a little | 20% | 20% |
| Not bother you at all | 18% | 11% |
| (VOL) Don’t know | 3% | 3% |
| (n) | (802) | (1,034) |
METHODOLOGY
The Monmouth University Poll was sponsored and conducted by the Monmouth University Polling Institute from October 17 to 21, 2024 with a probability-based national random sample of 802 voters. Monmouth is responsible for all aspects of the survey design, data weighting and analysis. Interviews were conducted in English, and included 133 live landline telephone interviews, 220 live cell phone interviews, and 449 online surveys via a cell phone text invitation. Interviewing services were provided by Braun Research using telephone numbers randomly selected from a list of active registered voters obtained from Aristotle. The full sample is weighted for region, age, gender, race and listed partisanship based on the voter list and education based on US Census information (2022 CPS and 2021 ACS one-year surveys), with adjustments made for self-reported 2020 presidential vote. For results based on this sample, one can say with 95% confidence that the error attributable to sampling has a maximum margin of plus or minus 4.1 percentage points adjusted for sample design effects (1.41). Sampling error can be larger for sub-groups (see table below). In addition to sampling error, one should bear in mind that question wording and practical difficulties in conducting surveys can introduce error or bias into the findings of opinion polls.
Demographics (weighted)
Party (registration/inferred from vote history): 34% Republican, 35% Democrat, 31% other, none
Party (self-reported): 28% Republican, 42% Independent, 30% Democrat
Sex: 47% men, 52% women, 2% other
Age: 25% 18-34, 23% 35-49, 26% 50-64, 26% 65+
Race: 69% White, 12% Black, 12% Hispanic, 7% Asian/other
Education: 31% high school or less, 31% some college, 24% 4 year degree, 14% graduate degree
Click on pdf file link below for full methodology and crosstabs by key demographic groups.


