West Long Branch, NJ – Democrats’ enthusiasm has skyrocketed since they swapped their presidential nominee. The latest national Monmouth (“Mon-muth”) University Poll finds voter support for Vice President Kamala Harris slightly higher than it was for President Joe Biden, while the number who back former President Donald Trump has remained steady. Harris has higher favorability ratings than either Trump or Biden, which means there has been in a decline in the number of double haters, that is voters who dislike both nominees. Harris also has a clear advantage over Trump in being seen as having the necessary stamina for the job and matches or slightly edges her Republican opponent on understanding people’s concerns, representing American values, and bringing about change.
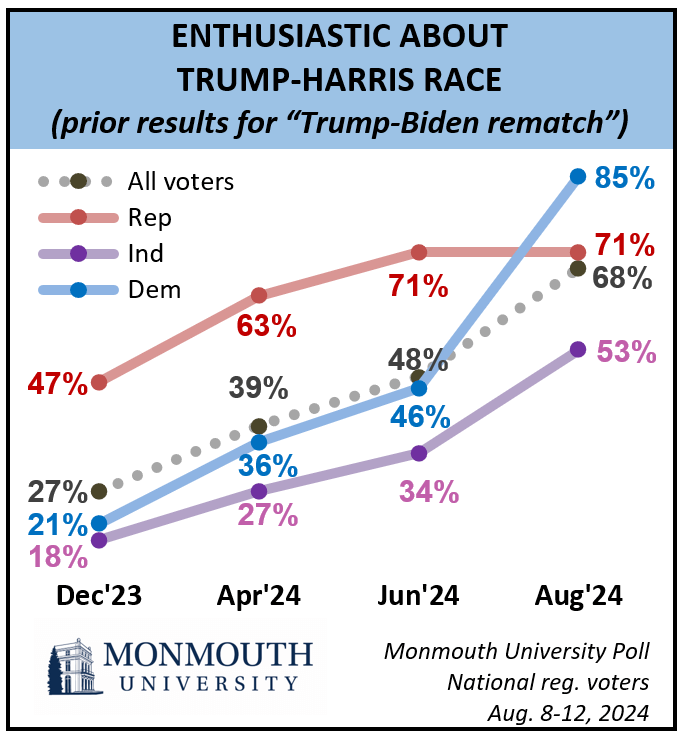
A huge shift in enthusiasm is the most vivid finding in the poll. While the number of voters who were at least somewhat enthusiastic about the Trump versus Biden rematch had been increasing throughout the year, it never topped 50%. Now that the contest is Trump versus Harris, voter enthusiasm has risen to 68%. The biggest jump has been among Democrats (from 46% in June to 85% now), but there has also been a notable increase in enthusiasm among independents (from 34% to 53%). Among Republicans, enthusiasm for the Trump-Harris contest (71%) is identical to what it was for the Trump-Biden rematch in June (71%).
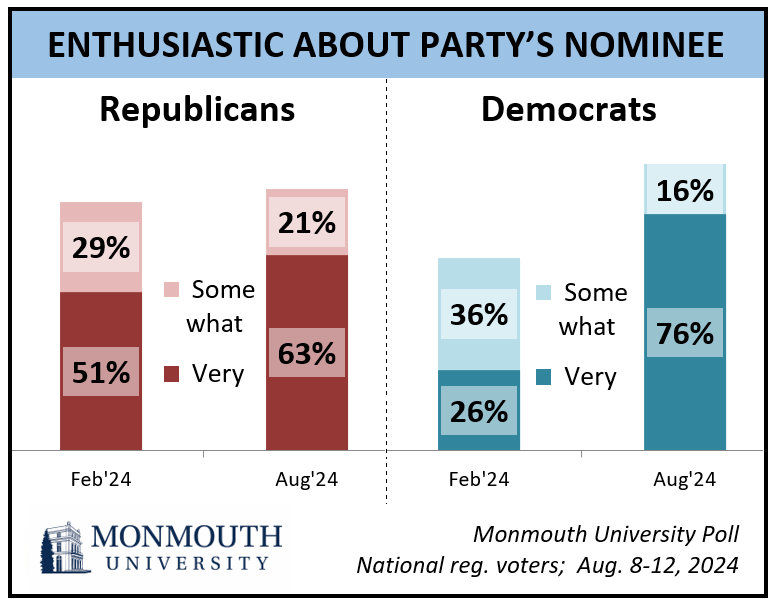
Monmouth also asked specifically about enthusiasm for each party’s choice of nominee. The national electorate’s enthusiasm for Trump as the Republican nominee (41%) is basically unchanged from February (40%). However, enthusiasm for Harris as the Democratic standard-bearer (47%) is significantly higher than it was for Biden earlier this year (32%). Currently, Democratic voters are slightly more enthusiastic about having Harris as their nominee (92%) than Republicans are about having Trump at the top of their ticket (84%). Back in February, Republican enthusiasm for Trump was similarly high (80%), but Democratic enthusiasm about the prospect of Biden being their nominee was significantly lower (62%).
“This is clearly a different ballgame. The nominee change has raised the ceiling for potential Democratic support in the presidential contest by a small but crucial amount, at least for now,” said Patrick Murray, director of the independent Monmouth University Polling Institute.
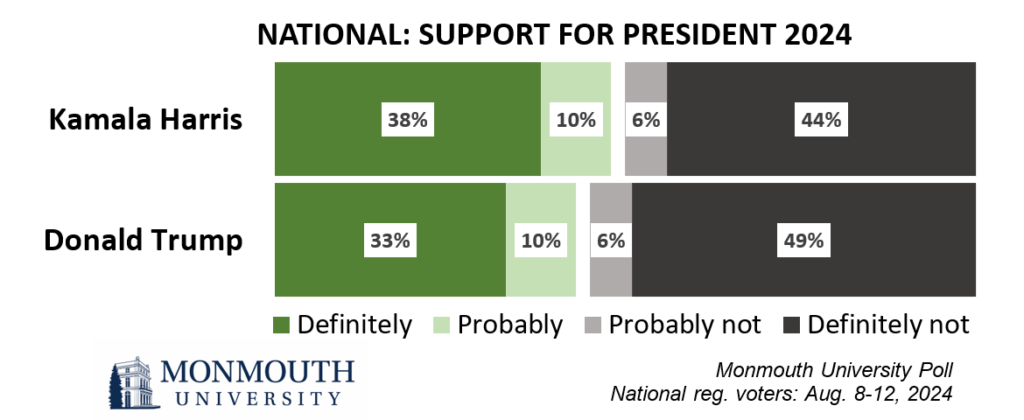
Just under half of registered voters say they will either definitely (38%) or probably (10%) vote for Harris in November and, in a separate question, just over 4 in 10 will definitely (33%) or probably (10%) support Trump. About half say they will definitely not vote for Trump (49%), while a somewhat smaller number say they definitely will not vote for Harris (44%). Trump support levels are virtually unchanged from Monmouth polls conducted since the fall. Support for Harris is stronger than it was for Biden, both in terms of total overall support (48% compared with between 42% and 44% for Biden between September and June) as well as the number who have definitely ruled her out (44% compared with a higher 48% to 51% for Biden).
Harris’s entry into the race has improved Democratic support among younger voters (53% of 18- to 35-year-old voters) compared to where Biden stood with this group two months ago (33%). At the same time, she has maintained Biden-level support among older voters, including those age 65 and over (51%, similar to Biden’s 52% support level with this group in June). Harris gets 62% support from Hispanic, Black, and Asian voters, 57% support from white voters who graduated college, and 33% support from white voters without a college degree. These results are a few points higher than where Biden stood with these groups in June.
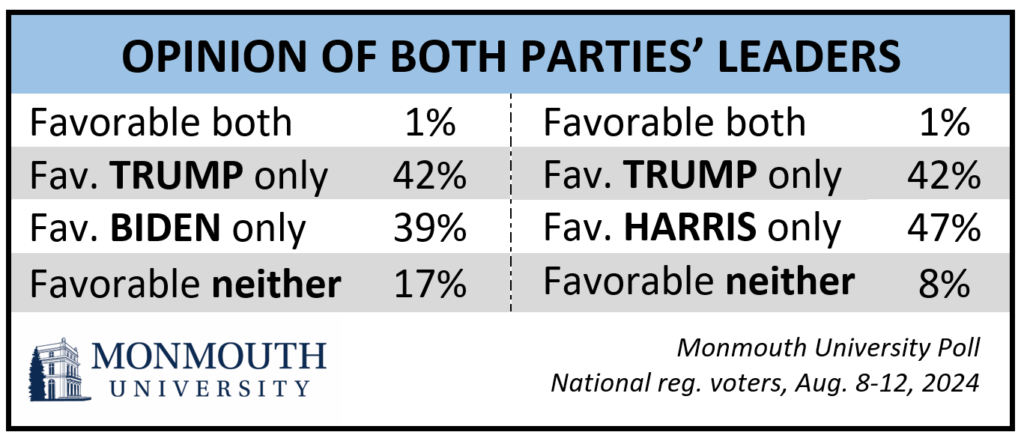
One feature of the Trump-Biden race was the so-called double haters – voters who held an unfavorable view of both candidates. Nearly 1 in 5 registered voters fell into this category when Biden was still running. That number remains virtually unchanged as it applies to Biden and Trump in the current poll – with 17% of voters not having a favorable opinion of either man. However, with Harris now in the race, the number of double haters for the current nominees has been cut in half. When favorability ratings for Harris and Trump are combined, just 8% do not have a favorable opinion of either candidate. Monmouth’s June poll found that 54% of the double haters were not supporting either candidate, with 28% backing Biden and 19% backing Trump. In the current poll, Harris actually holds majority support (53%) among these Biden-Trump double haters, with just 11% voting for Trump and 35% backing neither candidate.
“Taking Biden out of the mix and replacing him with Harris has significantly altered a key metric in this race. As we reported last month, Trump-Biden double haters want to shake things up, but they are wary of change that is too authoritarian. Harris appears to provide most of this group with the fresh outlook they desire,” said Murray.

Monmouth asked about potential support for four independent and third-party candidates, although none have yet been officially certified for the ballot in all 50 states. The number of voters who say they will definitely support one of these candidates includes 2% for independent Robert F. Kennedy, Jr., 1% each for independent Cornel West and the Green Party’s Jill Stein, and less than 1% for the Libertarian Party’s Chase Oliver. Combining those who say they will definitely or probably vote for one of these options shows Kennedy with 14% potential support, Stein with 4%, West with 3%, and Oliver with 2%. The potential vote for these other candidates seems to have an equal impact on both major party nominees. When definite independent and third-party support is included in the mix, Trump and Harris each lose just one percentage point from their initial backing. When all potential support for these four candidates is included, each major party nominee loses seven points off their initial support levels.
The ability to simply carry out the job of president dominated the election conversation before Biden dropped out. Currently, 57% of voters are at least somewhat confident that Harris has the mental and physical stamina necessary for the presidency, while 47% say the same about Trump. Confidence in Trump’s ability is a few points lower than in February (51%), but confidence in Harris’s ability is significantly higher than it was for Biden earlier this year (32%).

“The center of gravity has clearly shifted when it comes to talking about the candidates’ ability to carry out the job. Of course, the fact that this metric is not even higher for the 59-year-old is just another example of how entrenched partisan tribalism has become in the American electorate,” said Murray.
Harris (45%) matches Trump (46%) when it comes to confidence in bringing about the kind of change our country needs, although more voters say they are very confident in Trump. Harris has a small advantage when voters are asked how much the candidates understand the day-to-day concerns of people like them – 49% say she understands this a great deal or some compared with 44% who say the same about Trump. Harris (51%) edges Trump (48%) when it comes to being seen as representing true American values either a great deal or some.
In other poll findings, 48% of voters currently support the Democratic congressional candidate in their U.S. House district, while 46% back the Republican. Monmouth’s June poll showed this generic national House ballot at 48% for the Republicans and 45% for the Democrats.
In terms of personal ratings, Harris (48% favorable and 50% unfavorable) has an advantage over Trump (43% favorable and 56% unfavorable), although neither candidate’s rating is a net positive. Turning to their running mates, Minnesota Governor Tim Walz has a net positive rating (37% favorable and 30% unfavorable) while Ohio U.S. Senator J.D. Vance has a net negative one (36% favorable and 41% unfavorable). About one-third of voters have not heard of or have no opinion of Walz and about a quarter cannot rate Vance. Among other presidential candidates, Kennedy has a net negative 32% favorable and 42% unfavorable rating. The vast majority of voters do not know enough about the other three presidential candidates included in the poll to offer an opinion on them.
The Monmouth University Poll was conducted by telephone and online from August 8 to 12, 2024 with 801 registered voters in the United States. The question results in this release have a margin of error +/- 4.0 percentage points. The poll was conducted by the Monmouth University Polling Institute in West Long Branch, NJ.
QUESTIONS AND RESULTS
(* Some columns may not add to 100% due to rounding.)
[QUESTIONS 1 & 2 WERE ROTATED]
1.Is your general impression of Donald Trump very favorable, somewhat favorable, somewhat unfavorable, or very unfavorable?
| Trend: Registered voters | Aug. 2024 | June 2024 | April 2024 | Sept 2023 | July 2023 | Aug. 2022 |
|---|---|---|---|---|---|---|
| Very favorable | 29% | 26% | 23% | 19% | 15% | 22% |
| Somewhat favorable | 14% | 17% | 20% | 19% | 21% | 20% |
| Somewhat unfavorable | 7% | 8% | 9% | 12% | 13% | 9% |
| Very unfavorable | 49% | 48% | 48% | 50% | 50% | 40% |
| (VOL) No opinion * | 2% | 1% | 0% | 1% | 1% | 9% |
| (n) | (801) | (1,034) | (746) | (737) | (840) | (751) |
2.Is your general impression of Kamala Harris very favorable, somewhat favorable, somewhat unfavorable, or very unfavorable?
| Registered voters | Aug. 2024 |
|---|---|
| Very favorable | 31% |
| Somewhat favorable | 17% |
| Somewhat unfavorable | 8% |
| Very unfavorable | 42% |
| (VOL) No opinion | 2% |
| (n) | (801) |
3.Is your general impression of Joe Biden very favorable, somewhat favorable, somewhat unfavorable, or very unfavorable?
| Trend: Registered voters | Aug. 2024 | June 2024 | April 2024 | Sept 2023 | July 2023 |
|---|---|---|---|---|---|
| Very favorable | 18% | 19% | 21% | 18% | 18% |
| Somewhat favorable | 22% | 21% | 20% | 23% | 25% |
| Somewhat unfavorable | 12% | 11% | 10% | 14% | 13% |
| Very unfavorable | 47% | 48% | 48% | 45% | 44% |
| (VOL) No opinion | 2% | 1% | 1% | 1% | 0% |
| (n) | (801) | (1,034) | (746) | (737) | (840) |
4/5.I’m going to read you the names of some other people in the news. Please let me know if you have heard of them or not? [If HEARD OF:] For each of the following, please tell me if your general impression of them is very favorable, somewhat favorable, somewhat unfavorable, very unfavorable, or if you have no opinion? [NAMES WERE ROTATED]
| Registered voters | Very favorable | Somewhat favorable | Somewhat unfavorable | Very unfavorable | No opinion | Not heard of | (n) |
|---|---|---|---|---|---|---|---|
| Republican vice presidential candidate J.D. Vance | 22% | 14% | 8% | 33% | 9% | 14% | (801) |
| Democratic vice presidential candidate Tim Walz | 27% | 10% | 5% | 25% | 9% | 24% | (801) |
| Green Party presidential candidate Jill Stein | 1% | 7% | 9% | 12% | 19% | 52% | (801) |
| Independent presidential candidate Robert F. Kennedy, Jr. | 9% | 23% | 17% | 25% | 18% | 8% | (801) |
| — April 2024 | 8% | 27% | 14% | 26% | 18% | 8% | (746) |
| Independent presidential candidate Cornel West | 4% | 8% | 8% | 8% | 12% | 60% | (801) |
| Libertarian presidential candidate Chase Oliver | 1% | 1% | 2% | 1% | 8% | 87% | (801) |
[QUESTIONS 6 & 7 WERE ROTATED]
6.How likely are you to vote for Donald Trump in the election for president – will you definitely vote for him, probably vote for him, probably not vote for him, or definitely not vote for him?
| Registered voters | Aug. 2024 | Comparison: IN ELECTION AGAINST BIDEN | June 2024 | April 2024 | Feb. 2024 | Dec. 2023 | Sept. 2023 | July 2023 | May 2023 |
|---|---|---|---|---|---|---|---|---|---|
| Definitely | 33% | 32% | 30% | 30% | 29% | 31% | 26% | 29% | |
| Probably | 10% | 12% | 14% | 16% | 13% | 12% | 14% | 12% | |
| Probably not | 6% | 5% | 6% | 6% | 8% | 8% | 8% | 8% | |
| Definitely not | 49% | 49% | 48% | 47% | 48% | 48% | 50% | 46% | |
| (VOL) Don’t know | 2% | 2% | 2% | 1% | 2% | 1% | 1% | 4% | |
| (n) | (801) | (1,034) | (746) | (822) | (743) | (737) | (840) | (907) |
7.How likely are you to vote for Kamala Harris in the election for president – will you definitely vote for her, probably vote for her, probably not vote for her, or definitely not vote for her?
| Registered voters | Aug. 2024 | Comparison: LIKELY TO VOTE FOR BIDEN | June 2024 | April 2024 | Feb. 2024 | Dec. 2023 | Sept. 2023 | July 2023 | May 2023 |
|---|---|---|---|---|---|---|---|---|---|
| Definitely | 38% | 31% | 32% | 30% | 31% | 31% | 36% | 32% | |
| Probably | 10% | 12% | 11% | 14% | 11% | 11% | 11% | 13% | |
| Probably not | 6% | 6% | 6% | 7% | 7% | 6% | 6% | 7% | |
| Definitely not | 44% | 49% | 49% | 48% | 49% | 51% | 46% | 45% | |
| (VOL) Don’t know | 2% | 1% | 2% | 1% | 1% | 1% | 1% | 3% | |
| (n) | (801) | (1,034) | (746) | (822) | (743) | (737) | (840) | (907) |
[QUESTIONS 8A-8D WERE ROTATED]
8A.How likely are you to vote for Robert F. Kennedy, Jr. in the election for president – will you definitely vote for him, probably vote for him, probably not vote for him, or definitely not vote for him?
| Comparison: Registered voters | Aug. 2024 | April 2024* | Dec. 2023* |
|---|---|---|---|
| Definitely | 2% | 5% | 6% |
| Probably | 12% | 13% | 15% |
| Probably not | 24% | 24% | 26% |
| Definitely not | 56% | 56% | 48% |
| (VOL) Don’t know | 6% | 3% | 6% |
| (n) | (801) | (746) | (743) |
8B.How likely are you to vote for Jill Stein in the election for president – will you definitely vote for her, probably vote for her, probably not vote for her, or definitely not vote for her?
| Registered voters | Aug. 2024 |
|---|---|
| Definitely | 1% |
| Probably | 3% |
| Probably not | 23% |
| Definitely not | 65% |
| (VOL) Don’t know | 9% |
| (n) | (801) |
8C.How likely are you to vote for Cornel West in the election for president – will you definitely vote for him, probably vote for him, probably not vote for him, or definitely not vote for him?
| Registered voters | Aug. 2024 |
|---|---|
| Definitely | 1% |
| Probably | 2% |
| Probably not | 23% |
| Definitely not | 64% |
| (VOL) Don’t know | 10% |
| (n) | (801) |
8D.How likely are you to vote for Chase Oliver in the election for president – will you definitely vote for him, probably vote for him, probably not vote for him, or definitely not vote for him?
| Registered voters | Aug. 2024 |
|---|---|
| Definitely | <1% |
| Probably | 2% |
| Probably not | 23% |
| Definitely not | 66% |
| (VOL) Don’t know | 10% |
| (n) | (801) |
9.How do you feel about the upcoming election between Kamala Harris and Donald Trump – are you very enthusiastic, somewhat enthusiastic, not too enthusiastic, or not at all enthusiastic? [NAMES WERE ROTATED]
| Registered voters | Aug. 2024 | Comparison: BIDEN/TRUMP RACE | June 2024* | April 2024* | Dec. 2023* |
|---|---|---|---|---|---|
| Very enthusiastic | 45% | 26% | 20% | 14% | |
| Somewhat enthusiastic | 23% | 22% | 19% | 13% | |
| Not too enthusiastic | 15% | 18% | 22% | 20% | |
| Not at all enthusiastic | 15% | 32% | 38% | 49% | |
| (VOL) Don’t know | 2% | 2% | 1% | 3% | |
| (n) | (801) | (1,034) | (746) | (743) |
[QUESTIONS 10 & 11 WERE ROTATED]
10.Specifically, how do you feel about Donald Trump being the Republican Party’s nominee for president – are you very enthusiastic, somewhat enthusiastic, not too enthusiastic, or not at all enthusiastic?
| Trend: Registered voters | Aug. 2024 | Feb. 2024 | Sept. 2023* |
|---|---|---|---|
| Very enthusiastic | 28% | 22% | 19% |
| Somewhat enthusiastic | 13% | 18% | 18% |
| Not too enthusiastic | 6% | 10% | 10% |
| Not at all enthusiastic | 51% | 49% | 52% |
| (VOL) Don’t know | 2% | 1% | 1% |
| (n) | (801) | (822) | (737) |
11.Specifically, how do you feel about Kamala Harris being the Democratic Party’s nominee for president – are you very enthusiastic, somewhat enthusiastic, not too enthusiastic, or not at all enthusiastic?
| Registered voters | Aug. 2024 | Comparison: BIDEN | Feb. 2024 | Sept. 2023* |
|---|---|---|---|---|
| Very enthusiastic | 32% | 14% | 14% | |
| Somewhat enthusiastic | 15% | 18% | 18% | |
| Not too enthusiastic | 7% | 16% | 15% | |
| Not at all enthusiastic | 45% | 51% | 53% | |
| (VOL) Don’t know | 1% | 1% | 1% | |
| (n) | (801) | (822) | (737) |
[QUESTIONS 12 & 13 WERE ROTATED]
12.How confident are you that Donald Trump has the mental and physical stamina necessary to carry out the job of president – very confident, somewhat confident, not too confident, or not at all confident?
| Trend: Registered voters | Aug. 2024 | Feb. 2024 | June 2020 |
|---|---|---|---|
| Very confident | 38% | 36% | 33% |
| Somewhat confident | 9% | 15% | 12% |
| Not too confident | 7% | 10% | 11% |
| Not at all confident | 44% | 38% | 43% |
| (VOL) Don’t know | 2% | 1% | 1% |
| (n) | (801) | (822) | (733) |
13.How confident are you that Kamala Harris has the mental and physical stamina necessary to carry out the job of president – very confident, somewhat confident, not too confident, or not at all confident?
| Registered voters | Aug. 2024 | Comparison: BIDEN | Feb. 2024 | June 2020 |
|---|---|---|---|---|
| Very confident | 42% | 12% | 23% | |
| Somewhat confident | 15% | 20% | 29% | |
| Not too confident | 8% | 15% | 11% | |
| Not at all confident | 33% | 52% | 34% | |
| (VOL) Don’t know | 2% | 1% | 3% | |
| (n) | (801) | (822) | (733) |
[QUESTIONS 14 & 15 WERE ROTATED]
14.How confident are you that Donald Trump would bring about the kind of change our country needs – very confident, somewhat confident, not too confident, or not at all confident?
| Registered voters | Aug. 2024 |
|---|---|
| Very confident | 33% |
| Somewhat confident | 13% |
| Not too confident | 6% |
| Not at all confident | 49% |
| (VOL) Don’t know | 0% |
| (n) | (801) |
15.How confident are you that Kamala Harris would bring about the kind of change our country needs – very confident, somewhat confident, not too confident, or not at all confident?
| Registered voters | Aug. 2024 |
|---|---|
| Very confident | 24% |
| Somewhat confident | 21% |
| Not too confident | 8% |
| Not at all confident | 46% |
| (VOL) Don’t know | 0% |
| (n) | (801) |
[QUESTIONS 16 & 17 WERE ROTATED]
16.How much does Donald Trump understand the day to day concerns of people like you – a great deal, some, not much, or not at all?
| Registered voters | Aug. 2024 |
|---|---|
| Great deal | 30% |
| Some | 14% |
| Not much | 9% |
| Not at all | 46% |
| (VOL) Don’t know | 1% |
| (n) | (801) |
17.How much does Kamala Harris understand the day to day concerns of people like you – a great deal, some, not much, or not at all?
| Registered voters | Aug. 2024 |
|---|---|
| Great deal | 28% |
| Some | 21% |
| Not much | 10% |
| Not at all | 39% |
| (VOL) Don’t know | 1% |
| (n) | (801) |
[QUESTIONS 18 & 19 WERE ROTATED]
18.How much does Donald Trump represent true American values – a great deal, some, not much, or not at all?
| Registered voters | Aug. 2024 |
|---|---|
| Great deal | 35% |
| Some | 13% |
| Not much | 8% |
| Not at all | 43% |
| (VOL) Don’t know | 1% |
| (n) | (801) |
19.How much does Kamala Harris represent true American values – a great deal, some, not much, or not at all?
| Registered voters | Aug. 2024 |
|---|---|
| Great deal | 32% |
| Some | 19% |
| Not much | 10% |
| Not at all | 37% |
| (VOL) Don’t know | 2% |
| (n) | (801) |
20.How motivated are you to vote in the November election for president – extremely motivated, very motivated, somewhat motivated, or not that motivated?
| Registered voters | Aug. 2024 |
|---|---|
| Extremely motivated | 66% |
| Very motivated | 14% |
| Somewhat motivated | 12% |
| Not motivated | 7% |
| (VOL) Don’t know | 0% |
| (n) | (801) |
21.Do you feel optimistic or pessimistic about the 2024 presidential election? [Is that very or somewhat optimistic/pessimistic]?
| Registered voters | Aug. 2024 | Comparison: 2020 ELECTION | Late Sept. 2020 | Early Sept. 2020 | Aug. 2020 |
|---|---|---|---|---|---|
| Very optimistic | 39% | 30% | 33% | 29% | |
| Somewhat optimistic | 32% | 29% | 33% | 35% | |
| Somewhat pessimistic | 17% | 17% | 16% | 20% | |
| Very pessimistic | 9% | 17% | 11% | 12% | |
| (VOL) Neither, don’t care | n/a | 3% | 3% | 3% | |
| (VOL) Don’t know | 2% | 4% | 3% | 1% | |
| (n) | (801) | (809) | (758) | (785) |
22.If the election for U.S. House of Representatives was held today, would you vote for the Republican or the Democratic candidate in your Congressional district? [PARTIES WERE ROTATED] [If UNDECIDED:] At this time do you lean more toward the Republican or more toward the Democratic candidate?
| Trend: Registered voters | Aug. 2024 | June 2024 |
|---|---|---|
| Republican | 46% | 48% |
| Democrat | 48% | 45% |
| (VOL) Neither | 4% | 5% |
| (VOL) Don’t know | 2% | 2% |
| (n) | (801) | (1,034) |
23.Did you vote in the 2020 presidential election, or did you not vote for whatever reason? [If YES:] Who did you vote for – Donald Trump, Joe Biden, or another candidate? [NAMES WERE ROTATED]
| Trend: Registered voters | Aug. 2024 | June 2024 | April 2024 | Feb. 2024 | Dec. 2023 |
|---|---|---|---|---|---|
| Donald Trump | 38% | 40% | 40% | 41% | 40% |
| Joe Biden | 42% | 46% | 45% | 46% | 45% |
| Another candidate | 3% | 5% | 4% | 4% | 4% |
| Voted, did not name candidate | 2% | 1% | 1% | 2% | 2% |
| Did not vote | 15% | 8% | 10% | 7% | 9% |
| (n) | (801) | (1,034) | (746) | (822) | (743) |
METHODOLOGY
The Monmouth University Poll was sponsored and conducted by the Monmouth University Polling Institute from August 8 to 12, 2024 with a probability-based national random sample of 801 voters. Monmouth is responsible for all aspects of the survey design, data weighting and analysis. Interviews were conducted in English, and included 145 live landline telephone interviews, 280 live cell phone interviews, and 376 online surveys via a cell phone text invitation. Interviewing services were provided by Braun Research using telephone numbers randomly selected from a list of active registered voters obtained from Aristotle. The full sample is weighted for region, age, gender, race and listed partisanship based on the voter list and education based on US Census information (2022 CPS and 2021 ACS one-year surveys), with adjustments made for self-reported 2020 presidential vote. For results based on this sample, one can say with 95% confidence that the error attributable to sampling has a maximum margin of plus or minus 4.0 percentage points adjusted for sample design effects (1.32). Sampling error can be larger for sub-groups (see table below). In addition to sampling error, one should bear in mind that question wording and practical difficulties in conducting surveys can introduce error or bias into the findings of opinion polls.
Demographics (weighted)
Party (registration/inferred from vote history): 36% Republican, 34% Democrat, 30% other, none
Party (self-reported): 32% Republican, 39% Independent, 29% Democrat
Sex: 47% men, 51% women, 1% other
Age: 24% 18-34, 23% 35-49, 26% 50-64, 27% 65+
Race: 70% White, 11% Black, 13% Hispanic, 6% Asian/other
Education: 30% high school or less, 31% some college, 24% 4 year degree, 15% graduate degree
Click on pdf file link below for full methodology and crosstabs by key demographic groups.


