
West Long Branch, NJ – Nearly half of Americans feel they are struggling to remain where they are financially. This view has been persistently negative in the Monmouth (“Mon-muth”) University Poll over the past few years with very few saying federal government actions have helped with their families’ top concerns. Nearly half feel that President Joe Biden and former President Donald Trump, as well as both political parties in the U.S. Congress, are not really concerned with the economic well-being of average Americans.

Inflation (24%), the economy (14%) and everyday household bills (11%) top the list of biggest concerns facing American families right now. This has been the case since worries about the COVID pandemic started to wane three years ago. Republicans (62%) and independents (51%) are more likely than Democrats (32%) to name these financial concerns as having the most impact on their families. Democrats (22%) are slightly more likely than independents (14%) and Republicans (6%) to focus on other costs related to housing, health care and college, as well as job security as their top concerns. Democrats (21%) are also more likely than independents (12%) and Republicans (3%) to name cultural or political issues as the biggest concern for their families. including political stability, abortion, climate change, and civil rights – other than immigration, which is predominantly a Republican concern (8%).
When asked about the federal government’s impact on their top family concern, 47% say recent government actions have hurt them, 40% say there has been no impact, and just 13% say government actions have actually helped them. Most Republicans (72%) say their family has been hurt by the federal government, while 48% of independents say they have been hurt and 44% say there has been no impact. While few Democrats (18%) say their family’s top concern has been hurt by government actions, more say there has been no impact (52%) than say they have actually been helped (30%).
“Even with a declining inflation rate, prices continue to be much higher than they were four years ago. That’s the metric that has really mattered to many Americans over the past two years. Economic concerns may not be the top motivating factor for all voters but it defines the contours of this year’s election,” said Patrick Murray, director of the independent Monmouth University Polling Institute.
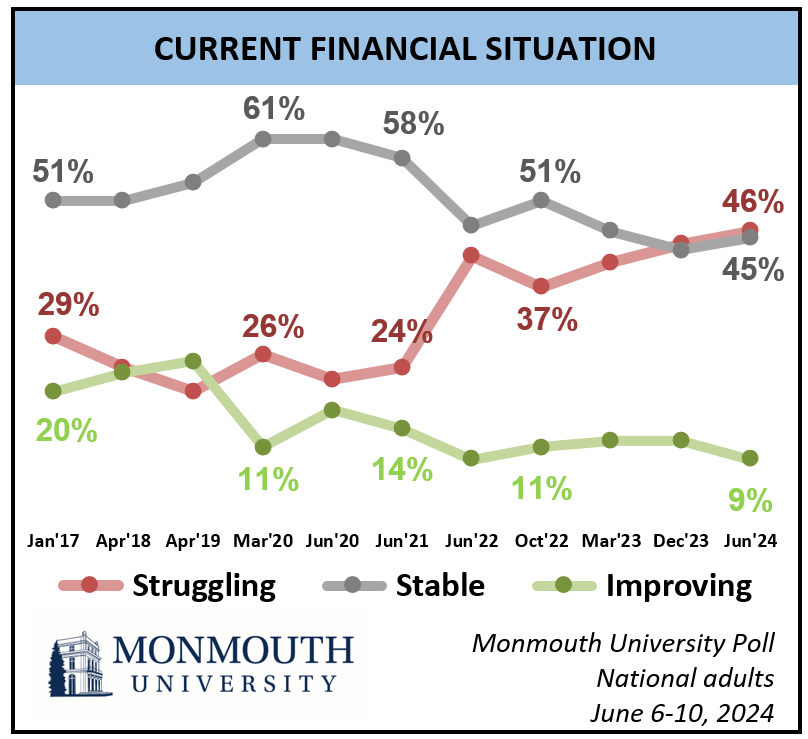
Currently, 46% of Americans say they are struggling to remain where they are financially. In polls conducted between 2022 and 2023, this number ranged between 37% and 44%. In prior polls from 2017 to 2021, this sentiment was much lower at 20% to 29%. Those who are more likely to feel they are struggling include Republicans (54%) and independents (49%), those who earn less than $50,000 a year (56%) and between $50,000 and $100,000 (47%), and those who are Black, Hispanic, Asian, or of another race (53%). Among non-Hispanic whites, those without a college degree (48%) are much more likely than college graduates (29%) to say they are struggling. Other groups who are less likely to say they are struggling include Democrats (30%) and those earning more than $100,000 a year (33%).
In the poll, 45% of Americans report having stable finances and another 9% say their financial situation is actually improving. Among voters who say they are stable or improving, 58% support Joe Biden in the upcoming presidential election and 32% support Donald Trump. Among voters who are struggling, 60% support Trump and 25% support Biden. [See Monmouth’s June 13 report for more 2024 presidential election data from this poll.]
“The overwhelming narrative is that a large segment of the American public feels it is financially behind the eight ball. It is true that voters who feel more comfortable with their economic situation are likely to support Biden. But despite continued Democratic efforts to tout rosy economic indicators, the tactic of telling financially pessimistic voters they should feel differently does not appear to be working,” said Murray.
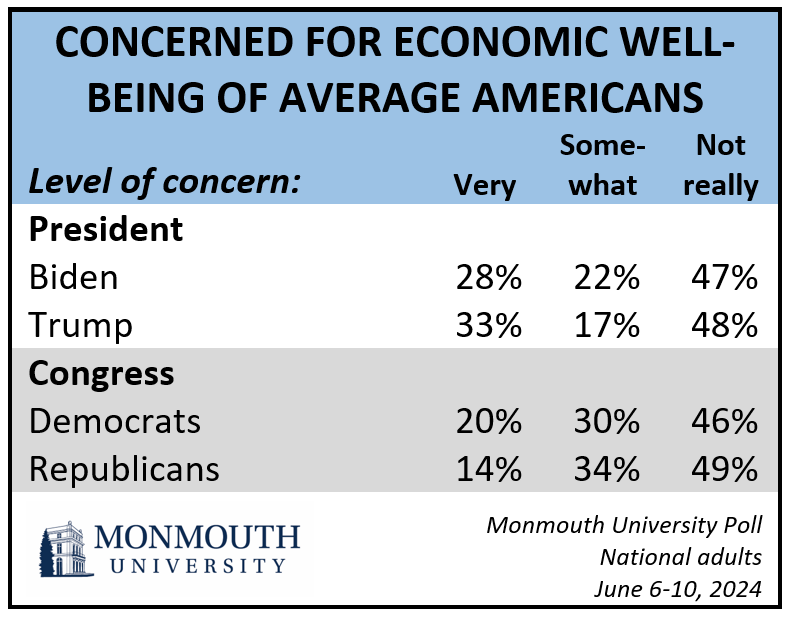
The Monmouth University Poll finds that no political actors at the federal level get high marks for empathizing with the public’s economic woes. Trump (33%) does slightly better than Biden (28%) at being seen as very concerned with looking out for the economic well-being of average Americans. However, nearly half say that either man is not really concerned about this – 48% for Trump and 47% for Biden. These results are in line with prior polls on Biden’s level of concern conducted in 2022 and 2023 and on Trump’s concern in 2018.
Looking down the other end of Pennsylvania Avenue, just 20% of the public says the Democrats in Congress are very concerned about looking out for the economic well-being of average Americans and even fewer say this about congressional Republicans (14%). Nearly half say the Democrats (46%) and the Republicans (49%) are not really concerned with average Americans’ well-being.
“There isn’t a lot of variation in these results, but it is interesting to note that the small differences seem to favor Trump at the presidential level and Democrats at the congressional level,” said Murray.
While many Americans are negative about their current finances, most feel better about what the future holds in store. Six in 10 are either very (20%) or somewhat (41%) optimistic about what their family’s financial situation will be 12 months from now. Democrats (83%) are more optimistic than Republicans (53%) and independents (54%). People of color (69%) and whites with a college education (66%) are somewhat more optimistic than whites without a college degree (52%). By income, higher earners (69% earning over $100,000 a year) are somewhat more optimistic than middle (59% earning $50,000-$100,000) or lower (57% earning under $50,000) earners, but majorities of all three income groups are at least somewhat optimistic about what the state of their finances will be next year.
The Monmouth University Poll was conducted by telephone from June 6 to 10, 2024 with 1,106 adults in the United States. The question results in this release have a margin of error of +/- 3.8 percentage points for the full sample. The poll was conducted by the Monmouth University Polling Institute in West Long Branch, NJ.
QUESTIONS AND RESULTS
(* Some columns may not add to 100% due to rounding.)
[Q1-6 previously released.]
[Q7-9 held for future release.]
10.Turning to issues closer to home, what is the biggest concern facing your family right now? [LIST WAS NOT READ]
| Trend: | June 2024 | March 2023 | June 2022 | Dec. 2021 | July 2021 | Aug. 2020 | March 2020 | April 2019 | April 2018 | Jan. 2017 | Jan. 2015 |
|---|---|---|---|---|---|---|---|---|---|---|---|
| The economy | 14% | 12% | 9% | 6% | 11% | 7% | 5% | 6% | 3% | 3% | 2% |
| Inflation | 24% | 25% | 48%* | 14% | 5% | n/a | n/a | n/a | n/a | n/a | n/a |
| Everyday bills, groceries, utilities etc. | 11% | 12% | 6% | 15% | 11% | 8% | 6% | 8% | 12% | 12% | 16% |
| Housing, mortgage, rent | 5% | 4% | 2% | 2% | 3% | 2% | 1% | 2% | 4% | 3% | 4% |
| Health care costs | 3% | 4% | 3% | 5% | 7% | 4% | 5% | 19% | 13% | 25% | 15% |
| College, school costs, loans | 2% | 1% | 2% | 1% | 2% | 1% | 0% | 3% | 4% | 4% | 10% |
| Job security, unemployment | 4% | 5% | 3% | 6% | 7% | 10% | 7% | 7% | 9% | 14% | 16% |
| Social Security, retirement | 1% | 3% | 1% | 1% | 1% | 2% | 0% | 3% | 4% | 5% | 5% |
| Taxes | 2% | 2% | 1% | 2% | 3% | 1% | 1% | 9% | 7% | 4% | 7% |
| Family illness, health | 1% | 2% | 1% | 4% | 3% | 4% | 3% | 3% | 3% | 3% | 4% |
| Safety, crime | 2% | 3% | 2% | 3% | 3% | 3% | 1% | 3% | 3% | 3% | 2% |
| Terrorism, national security | 1% | 1% | 0% | 0% | 1% | 1% | 0% | 1% | 2% | 2% | 1% |
| Immigration | 4% | 3% | 0% | 1% | 2% | 0% | 0% | 5% | 4% | 3% | 1% |
| Abortion, reproductive rights | 2% | 2% | 5% | n/a | n/a | n/a | n/a | n/a | n/a | n/a | n/a |
| Civil rights, race issues | 3% | 3% | 1% | 1% | 3% | 1% | 0% | 3% | 1% | 3% | n/a |
| Climate change, environment | 2% | 1% | 1% | 2% | 3% | 0% | 1% | 3% | 1% | 1% | n/a |
| Political stability, government integrity, democracy | 6% | 2% | 1% | 4% | 3% | 3% | 0% | 2% | 3% | 1% | 2% |
| Coronavirus/COVID-19 | 0% | 0% | 1% | 18% | 17% | 39% | 57% | n/a | n/a | n/a | n/a |
| Other | 5% | 7% | 9% | 3% | 6% | 7% | 4% | 9% | 10% | 4% | 6% |
| Don’t know/No answer | 10% | 10% | 6% | 11% | 9% | 8% | 9% | 16% | 15% | 10% | 8% |
| (n) | (1,106) | (805) | (978) | (808) | (804) | (868) | (851) | (801) | (803) | (801) | (1,003) |
[Question 11 was asked only of those who mentioned a concern in Q10: n=1,016, moe=+/-4.0 %]
11.Thinking about this most important concern, have the actions of the federal government over the past six months helped, hurt, or had no real impact on this concern?
| Trend: | June 2024 | March 2023 | June 2022 | Dec. 2021* | July 2021 | April 2019** | April 2018** | Jan. 2017*** | Jan. 2015*** |
|---|---|---|---|---|---|---|---|---|---|
| Helped | 13% | 10% | 8% | 25% | 31% | 14% | 14% | 27% | 14% |
| Hurt | 47% | 49% | 57% | 46% | 34% | 42% | 39% | 37% | 47% |
| No real impact | 40% | 38% | 34% | 27% | 31% | 42% | 44% | 34% | 38% |
| (VOL) Don’t know | 1% | 3% | 1% | 2% | 3% | 2% | 3% | 2% | 2% |
| (n) | (1,016) | (735) | (931) | (747) | (730) | (692) | (680) | (728) | (926) |
** 2019 and 2018 asked about “the past year”
*** 2017 and 2015 asked about “the past few years”
12.Thinking about your current financial situation, would you say you are struggling to remain where you are financially, basically stable in your current financial situation, or is your financial situation improving?
| Trend: | June 2024 | Dec. 2023 | March 2023 | Oct. 2022 | June 2022 | June 2021 | Late June 2020 | Early June 2020 | May 2020 | April 2020 | March 2020 | April 2019 | April 2018 | Jan. 2017 |
|---|---|---|---|---|---|---|---|---|---|---|---|---|---|---|
| Struggling | 46% | 44% | 41% | 37% | 42% | 24% | 22% | 20% | 23% | 26% | 26% | 20% | 24% | 29% |
| Stable | 45% | 43% | 46% | 51% | 47% | 58% | 61% | 65% | 63% | 62% | 61% | 54% | 51% | 51% |
| Improving | 9% | 12% | 12% | 11% | 9% | 14% | 17% | 13% | 13% | 11% | 11% | 25% | 23% | 20% |
| (VOL) Don’t know | 1% | 1% | 2% | 2% | 1% | 3% | 1% | 1% | 1% | 2% | 1% | 1% | 2% | 0% |
| (n) | (1,106) | (803) | (805) | (808) | (978) | (810) | (867) | (807) | (808) | (857) | (851) | (801) | (803) | (801) |
13.Do you feel optimistic or pessimistic about what your family’s financial situation will be 12 months from now? [Would you say very or somewhat optimistic/pessimistic?]
| Trend: | June 2024 | Dec. 2023 | Oct. 2022 |
|---|---|---|---|
| Very optimistic | 20% | 19% | 22% |
| Somewhat optimistic | 41% | 39% | 37% |
| Somewhat pessimistic | 23% | 19% | 18% |
| Very pessimistic | 11% | 20% | 19% |
| (VOL) Don’t know | 5% | 4% | 3% |
| (n) | (1,106) | (803) | (808) |
14.For each of the following people or groups, please tell me whether you think they are very concerned, somewhat concerned, or not really concerned with looking out for the economic well-being of average Americans? [ITEMS WERE ROTATED]
President Biden
| Trend: | June 2024 | Sept. 2023 | Jan. 2022 |
|---|---|---|---|
| Very concerned | 28% | 28% | 30% |
| Somewhat concerned | 22% | 23% | 22% |
| Not really concerned | 47% | 48% | 47% |
| (VOL) Don’t know | 3% | 2% | 0% |
| (n) | (1,106) | (814) | (794) |
Former President Trump
| Trend: | June 2024 | Aug. 2018 |
|---|---|---|
| Very concerned | 33% | 35% |
| Somewhat concerned | 17% | 17% |
| Not really concerned | 48% | 46% |
| (VOL) Don’t know | 2% | 2% |
| (n) | (1,106) | (805) |
The Democrats in Congress
| Trend: | June 2024 | Sept. 2023 | Jan. 2022 | Aug. 2018 |
|---|---|---|---|---|
| Very concerned | 20% | 22% | 23% | 22% |
| Somewhat concerned | 30% | 28% | 31% | 38% |
| Not really concerned | 46% | 47% | 47% | 35% |
| (VOL) Don’t know | 4% | 2% | 0% | 5% |
| (n) | (1,106) | (814) | (794) | (805) |
The Republicans in Congress
| Trend: | June 2024 | Sept. 2023 | Jan. 2022 | Aug. 2018 |
|---|---|---|---|---|
| Very concerned | 14% | 15% | 20% | 17% |
| Somewhat concerned | 34% | 33% | 37% | 39% |
| Not really concerned | 49% | 50% | 42% | 40% |
| (VOL) Don’t know | 3% | 2% | 1% | 4% |
| (n) | (1,106) | (814) | (794) | (805) |
[Q15-18 & Q30-38 previously released.]
[Q19-29 held for future release.]
METHODOLOGY
The Monmouth University Poll was sponsored and conducted by the Monmouth University Polling Institute from June 6 to 10, 2024 with a probability-based national random sample of 1,106 adults age 18 and older. Interviews were conducted in English, and included 262 live landline telephone interviews, 348 live cell phone interviews, and 496 online surveys via a cell phone text invitation. Telephone numbers were selected through a mix of random digit dialing and list-based sampling. Landline respondents were selected with a modified Troldahl-Carter youngest adult household screen. Interviewing services were provided by Braun Research, with sample obtained from Dynata (RDD, n= 756), Aristotle (list, n= 182) and a panel of prior Monmouth poll participants (n= 168). Monmouth is responsible for all aspects of the survey design, data weighting and analysis. The full sample is weighted for region, age, education, gender and race based on US Census information (ACS 2022 one-year survey). For results based on this sample, one can say with 95% confidence that the error attributable to sampling has a maximum margin of plus or minus 3.8 percentage points adjusted for sample design effects (1.69). Sampling error can be larger for sub-groups (see table below). In addition to sampling error, one should bear in mind that question wording and practical difficulties in conducting surveys can introduce error or bias into the findings of opinion polls.
Demographics (weighted)
Party (self-reported): 28% Republican, 44% Independent, 28% Democrat
Sex: 49% male, 50% female, 1% other
Age: 29% 18-34, 33% 35-54, 38% 55+
Race: 61% White, 12% Black, 17% Hispanic, 10% Asian/other
Education: 37% high school or less, 30% some college, 18% 4 year degree, 15% graduate degree
Click on pdf file link below for full methodology and crosstabs by key demographic groups.


