
West Long Branch, NJ – A Monmouth (“Mon-muth”) University Poll of Pennsylvania voters finds a very close race for the U.S. Senate between Democratic incumbent Bob Casey and Republican challenger Dave McCormick. Voter preferences in the senate contest mirror their presidential choice with little indication of significant ticket-splitting across the two contests. The poll finds Casey and McCormick with nearly identical personal ratings and very little difference between the two in trust on the issues. The only exception is handling abortion policy, where the Democrat has an advantage.
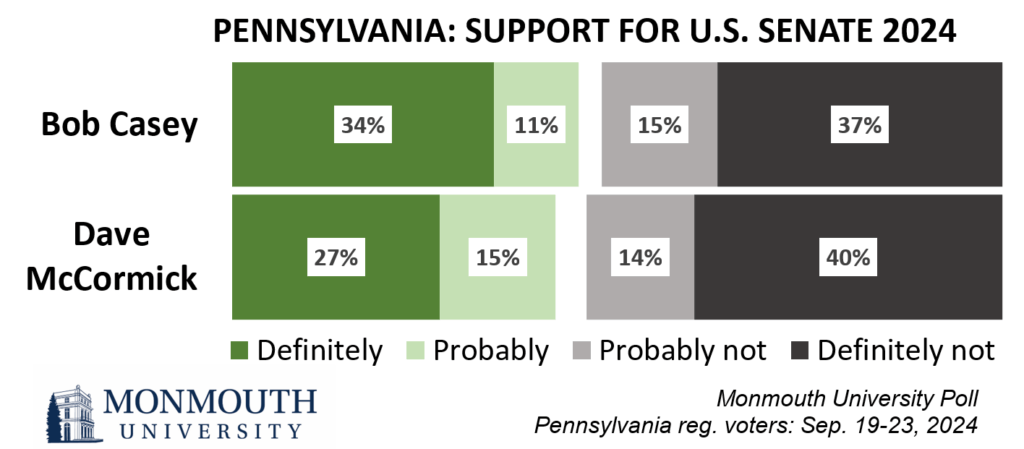
More than 4 in 10 Pennsylvania voters say they will either definitely (34%) or probably (11%) vote for Casey in November and, in a separate question, a similar number will definitely (27%) or probably (15%) support McCormick. At the other end of the spectrum, 40% say they will definitely not vote for McCormick while 37% say they definitely will not vote for Casey.
There is not much evidence in the poll that Pennsylvania voters intend to split their votes this year from the party of their presidential candidate preference. Specifically, 84% of Donald Trump supporters say they will definitely or probably vote for McCormick and just 3% will vote for Casey. Among backers of Kamala Harris, 87% intend to vote for Casey and just 5% support McCormick. There is slightly more indecision among Trump voters (12% no candidate choice) than Harris voters (7%) when it comes to the U.S. Senate race.
“The McCormick campaign’s attack strategy has been to tie Casey to Harris. That may be why we don’t see a lot of daylight between voter preferences in the senate and presidential races,” said Patrick Murray, director of the independent Monmouth University Polling Institute.
Monmouth also asked about potential support for third-party candidates in the senate race. Just 2% of registered voters in Pennsylvania say they will definitely support one of these candidates while another 5% say they will probably support one of these candidates. The third-party factor shaves about two percentage points off McCormick’s total support and about one point off Casey’s support.
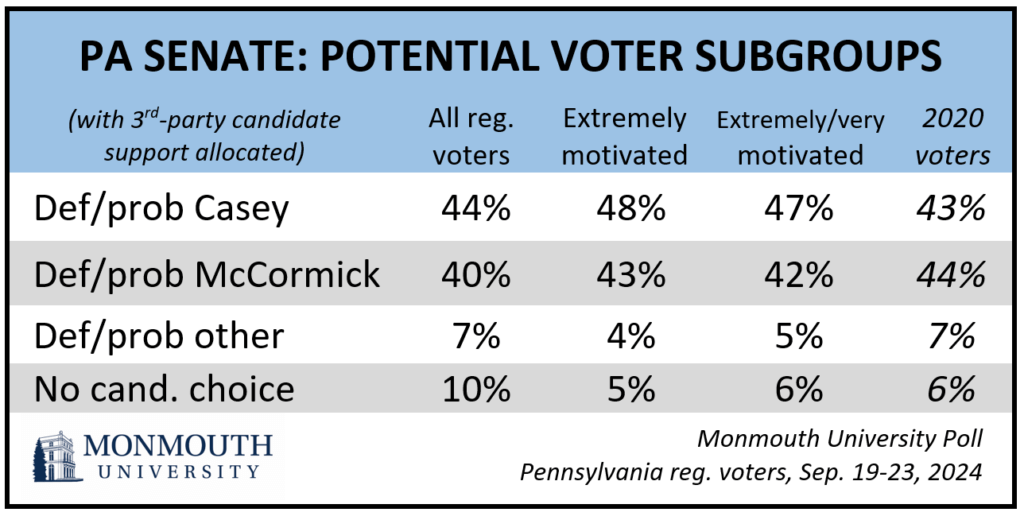
The poll was conducted among Pennsylvania registered voters, but not all of them will actually vote. If the electorate is identical to turnout from the 2020 election, then the race could be exceedingly tight. Specifically, among those who were validated as having voted in the 2020 election according to the registration list, Casey has 43% support and McCormick has 44%.
The picture of this race shifts slightly when examining a key turnout metric – motivation. Among voters who describe themselves as extremely motivated to cast a ballot this year, Casey has 48% definite or probable support and McCormick has 43% support. Third-party candidate backing drops to 4% among extremely motivated voters and the proportion of the motivated electorate who can be described as undecided – meaning they do not lean toward any candidate – stands at 5%.
Turning to the U.S. House election in Pennsylvania, a generic congressional ballot test gives Republicans 49% of the potential statewide vote and Democrats get 47%. Among the extremely motivated voters, though, the vote share flips, with Democrats getting 50% support and Republicans getting 48%.
“Motivation seems to be working in the Democrats’ favor right now. However, all these Pennsylvania contests – from president to U.S. Senate to competitive House seats – are extremely close and could easily go either way,” said Murray.
The poll finds that most candidate metrics in the U.S. Senate contest register about the same for the two major party nominees. Just under half have a favorable rating of Casey (47%) and McCormick (47%). When these ratings are taken together, 6% of Pennsylvania voters have a favorable opinion of both candidates, 41% have a favorable opinion of Casey only, 41% have a favorable opinion of McCormick only, and 10% do not have a favorable opinion of either man.
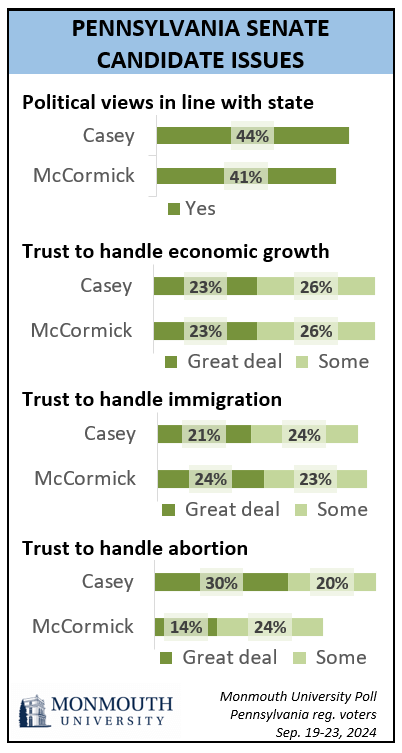
Turning to important issues in the election, similar numbers of voters say the political views of Casey (44%) and McCormick (41%) are in line with most residents of Pennsylvania. Identical numbers trust Casey (49%) and McCormick (49%) at least somewhat to handle economic growth. Nearly identical numbers trust Casey (45%) and McCormick (47%) to handle immigration. The only policy area where voters differentiate between the two candidates is abortion. On this issue, 50% of Pennsylvania voters trust Casey while 38% trust McCormick.
“The question is not which issue will win over undecided voters, but which issue will motivate more voters on your side to cast a ballot,” said Murray.
The Monmouth University Poll was conducted by telephone and online from September 19 to 23, 2024 with 654 Pennsylvania registered voters. The question results in this release have a margin of error +/- 4.5 percentage points. The poll was conducted by the Monmouth University Polling Institute in West Long Branch, NJ.
QUESTIONS AND RESULTS
(* Some columns may not add to 100% due to rounding.)
[Q1-6 previously released.]
[QUESTIONS 7 & 8 WERE ROTATED]
Turning to the candidates for U.S. Senate this year…
7.Is your general impression of Dave McCormick, the Republican candidate, very favorable, somewhat favorable, somewhat unfavorable, or very unfavorable?
| Registered voters | Sept. 2024 |
|---|---|
| Very favorable | 20% |
| Somewhat favorable | 27% |
| Somewhat unfavorable | 14% |
| Very unfavorable | 36% |
| (VOL) No opinion | 2% |
| (n) | (654) |
8.Is your general impression of Bob Casey, the Democratic candidate, very favorable, somewhat favorable, somewhat unfavorable, or very unfavorable?
| Registered voters | Sept. 2024 |
|---|---|
| Very favorable | 23% |
| Somewhat favorable | 24% |
| Somewhat unfavorable | 16% |
| Very unfavorable | 35% |
| (VOL) No opinion | 1% |
| (n) | (654) |
[QUESTIONS 9 & 10 WERE ROTATED]
9.How likely are you to vote for Dave McCormick in the election for U.S. Senate – will you definitely vote for him, probably vote for him, probably not vote for him, or definitely not vote for him?
| Registered voters | Sept. 2024 |
|---|---|
| Definitely | 27% |
| Probably | 15% |
| Probably not | 14% |
| Definitely not | 40% |
| (VOL) Don’t know | 4% |
| (n) | (654) |
10.How likely are you to vote for Bob Casey in the election for U.S. Senate – will you definitely vote for him, probably vote for him, probably not vote for him, or definitely not vote for him?
| Registered voters | Sept. 2024 |
|---|---|
| Definitely | 34% |
| Probably | 11% |
| Probably not | 15% |
| Definitely not | 37% |
| (VOL) Don’t know | 3% |
| (n) | (654) |
11.How likely are you to vote for one of the third party candidates running for U.S. Senate this year – will you definitely vote for a third party candidate, probably vote third party, probably not vote third party, or definitely not vote for a third party candidate?
| Registered voters | Sept. 2024 |
|---|---|
| Definitely | 2% |
| Probably | 5% |
| Probably not | 19% |
| Definitely not | 71% |
| (VOL) Don’t know | 3% |
| (n) | (654) |
[QUESTIONS 12 & 13 WERE ROTATED]
12.Are Dave McCormick’s political views in line or out of step with most residents of Pennsylvania?
| Registered voters | Sept. 2024 |
|---|---|
| In line | 41% |
| Out of step | 47% |
| (VOL) Don’t know | 12% |
| (n) | (654) |
13.Are Bob Casey’s political views in line or out of step with most residents of Pennsylvania?
| Registered voters | Sept. 2024 |
|---|---|
| In line | 44% |
| Out of step | 46% |
| (VOL) Don’t know | 9% |
| (n) | (654) |
[Q14-17 previously released.]
[QUESTIONS 18A & 18B WERE ROTATED]
Turning to the candidates for U.S. Senate…
18A.How much do you trust Dave McCormick to handle the issue of economic growth – a great deal, some, not much, or not at all?
| Registered voters | Sept. 2024 |
|---|---|
| Great deal | 23% |
| Some | 26% |
| Not much | 16% |
| Not at all | 33% |
| (VOL) Don’t know | 3% |
| (n) | (654) |
18B.How much do you trust Bob Casey to handle the issue of economic growth – a great deal, some, not much, or not at all?
| Registered voters | Sept. 2024 |
|---|---|
| Great deal | 23% |
| Some | 26% |
| Not much | 18% |
| Not at all | 32% |
| (VOL) Don’t know | 2% |
| (n) | (654) |
[QUESTIONS 19A & 19B WERE ROTATED]
19A.How much do you trust Dave McCormick to handle the issue of immigration – a great deal, some, not much, or not at all?
| Registered voters | Sept. 2024 |
|---|---|
| Great deal | 24% |
| Some | 23% |
| Not much | 14% |
| Not at all | 37% |
| (VOL) Don’t know | 2% |
| (n) | (654) |
19B.How much do you trust Bob Casey to handle the issue of immigration – a great deal, some, not much, or not at all?
| Registered voters | Sept. 2024 |
|---|---|
| Great deal | 21% |
| Some | 24% |
| Not much | 14% |
| Not at all | 39% |
| (VOL) Don’t know | 2% |
| (n) | (654) |
[QUESTIONS 20A & 20B WERE ROTATED]
20A.How much do you trust Dave McCormick to handle the issue of abortion – a great deal, some, not much, or not at all?
| Registered voters | Sept. 2024 |
|---|---|
| Great deal | 14% |
| Some | 24% |
| Not much | 12% |
| Not at all | 44% |
| (VOL) Don’t know | 6% |
| (n) | (654) |
20B.How much do you trust Bob Casey to handle the issue of abortion – a great deal, some, not much, or not at all?
| Registered voters | Sept. 2024 |
|---|---|
| Great deal | 30% |
| Some | 20% |
| Not much | 15% |
| Not at all | 28% |
| (VOL) Don’t know | 6% |
| (n) | (654) |
[Q21-22 previously released.]
23.How will you vote this year – in person on Election Day, in person at an early voting location, by mail ballot, or won’t you vote at all?
| Registered voters | Sept. 2024 |
|---|---|
| In person on Election Day | 69% |
| In person at an early voting location | 5% |
| By mail ballot | 24% |
| Won’t vote at all | 2% |
| (VOL) Don’t know | 1% |
| (n) | (654) |
24.If the election for U.S. House of Representatives was held today, would you vote for the Republican or the Democratic candidate in your Congressional district? [PARTIES WERE ROTATED] [If UNDECIDED: At this time do you lean more toward the Republican or more toward the Democratic candidate?]
| Registered voters | Sept. 2024 |
|---|---|
| Republican | 49% |
| Democratic | 47% |
| (VOL) Neither | 3% |
| (VOL) Don’t know | 1% |
| (n) | (654) |
[Q25 previously released.]
METHODOLOGY
The Monmouth University Poll was sponsored and conducted by the Monmouth University Polling Institute from September 19 to 23, 2024 with a probability-based random sample of 654 Pennsylvania voters. Monmouth is responsible for all aspects of the survey design, data weighting and analysis. Interviews were conducted in English, and included 111 live landline telephone interviews, 182 live cell phone interviews, and 361 online surveys via a cell phone text invitation. Interviewing services were provided by Braun Research using telephone numbers randomly selected from a list of active registered voters obtained from Aristotle. The full sample is weighted for region, age, gender, race and listed partisanship based on the voter list and education based on US Census information (2022 CPS and 2021 ACS one-year surveys), with adjustments made for self-reported 2020 presidential vote. For results based on this sample, one can say with 95% confidence that the error attributable to sampling has a maximum margin of plus or minus 4.5 percentage points adjusted for sample design effects (1.36). Sampling error can be larger for sub-groups (see table below). In addition to sampling error, one should bear in mind that question wording and practical difficulties in conducting surveys can introduce error or bias into the findings of opinion polls.
Demographics (weighted)
Party (registration): 42% Republican, 44% Democrat, 14% other, none
Party (self-reported): 36% Republican, 29% Independent, 35% Democrat
Sex: 47% men, 52% women, 1% other
Age: 23% 18-34, 23% 35-49, 26% 50-64, 28% 65+
Race: 82% White, 10% Black, 5% Hispanic, 3% Asian/other
Education: 37% high school or less, 25% some college, 23% 4 year degree, 15% graduate degree
Region: 11% Philadelphia, 22% Philly suburbs, 15% Northeast, 17% PA Dutch Country,
11% Central, 14% Western, 10% Allegheny
Click on pdf file link below for full methodology and crosstabs by key demographic groups.