West Long Branch, NJ – Neither Trenton nor Washington is clicking on all cylinders but the federal government scores slightly worse, according to the New Jersey public in a new Monmouth (“Mon-muth”) University Poll. Just under half of Garden State residents see politics as a “dirty business” – a view that has increased over the past 15 years. Still, a majority feel they can personally make a difference in solving problems in their local communities and half report having done so.
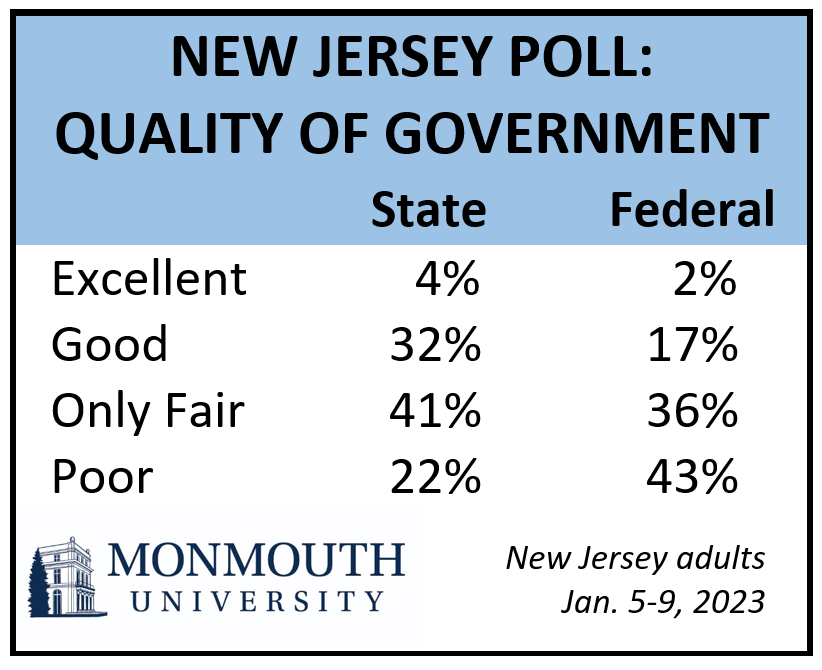
A little more than one-third (36%) of New Jerseyans rate the quality of their state government as either excellent or good while only 19% say the same about the federal government. When asked to compare the two levels directly, 29% say the government in Trenton is better run and 9% say Washington works better, while the majority (57%) say the two governments are run about the same. Among New Jersey Democrats, 37% pick Trenton and 12% choose Washington as the better run government. Republicans are less likely to name either level (24% Trenton and 6% Washington), with the vast majority (68%) saying they are about the same. The views of independents are nearly identical to Republicans. However, it should also be noted that the New Jersey government rating, while low, is better than it was a decade ago (24% in 2010).

“A pox on both your houses say New Jerseyans. It may never be possible to get a majority of the public to view government in a positive light in this day and age. But it may be some comfort to Trenton officials that at least some New Jerseyans think they are doing a better job than the folks in Washington,” said Patrick Murray, director of the independent Monmouth University Polling Institute.
Democrats (63%) are a lot more likely than Republicans (14%) to rate the state government positively. They are also somewhat more likely to give positive reviews to the quality of the federal government, although both partisan groups’ opinion of Washington is largely negative – just 31% excellent or good ratings among Democrats and 7% among Republicans. Again, independents’ views on both levels of government are more in line with Republican than Democratic opinion. Interestingly, past polls on the quality of state government showed less of a partisan divide than in the current results. In 2009, when Democrats controlled both the executive and legislative branches, Democrats (44% excellent/good) had a slightly better view of Trenton than Republicans (20%), and independents (17%). Republican opinion (38% positive) ticked up the following year when a GOP governor took office, while Democratic opinion (19%) slipped and independent (21%) opinion held steady. But these partisan gaps are nowhere near the nearly 50-point difference today.
“Partisanship fractures how we view government nowadays. You’ve got to stick with your team and boo the other guys no matter what. Which means independents tend to remain unhappy no matter who is in charge,” said Murray.
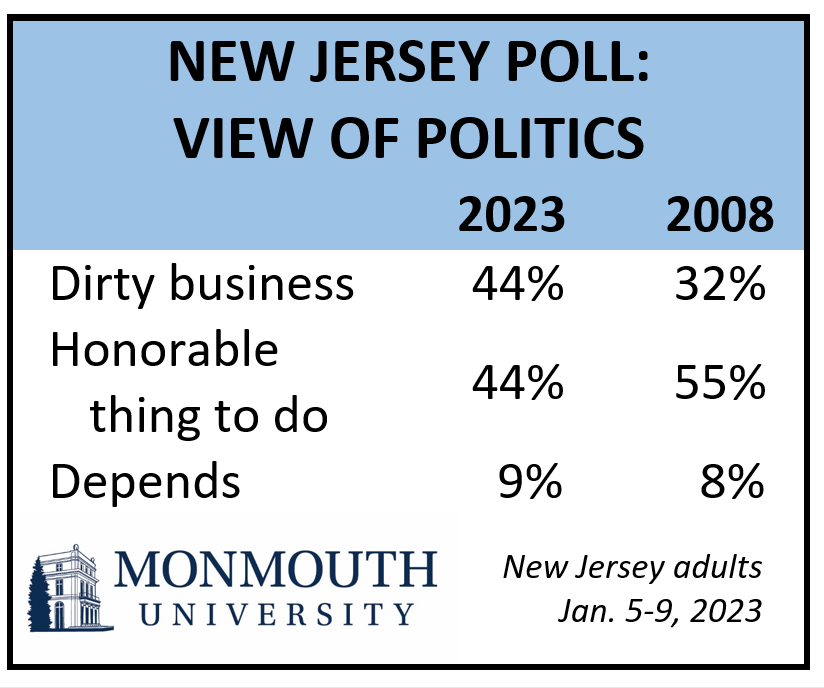
In related findings, New Jerseyans are divided on whether getting involved in politics and government is “a dirty business” (44%) or “an honorable thing to do” (44%). The number of residents who say politics is dirty has climbed over the past 15 years (32% in 2008). Republicans (52%) and independents (52%) are more likely than Democrats (33%) to have a negative image of politics. There are no significant generational differences in responses to this question.

“There are other ways to have an impact on civic life aside from politics, and many New Jerseyans appear to be engaging in them. In fact, Millennials and Gen Z adults seem to feel more empowered to make a difference than young adults were a decade ago,” said Murray.
A majority of New Jerseyans (55%) feel they personally can make at least some difference to solve problems in their communities. This number is somewhat higher than in a 2010 poll (45%). One in five (20%) New Jersey adults report working either alone or with a group to solve a problem in their community in the past 12 months. Another 31% say they worked on a community problem more than a year ago. While the proportion of New Jerseyans who have worked on a community problem over the most recent year has been fairly stable since 2008, those who report doing so at any time has increased. This has been most notable among younger adults. In 2010, one-third (33%) of 18- to 34-year-olds reported ever working to solve a community problem. In the current poll, more than half (55%) of 18- to 34-year-olds today say have done this.
The Monmouth University Poll was conducted by telephone from January 5 to 9, 2023 with 809 New Jersey adults. The question results in this release have a margin of error of +/- 4.7 percentage points for the full sample. The poll was conducted by the Monmouth University Polling Institute in West Long Branch, NJ.
QUESTIONS AND RESULTS
(* Some columns may not add to 100% due to rounding.)
[Q1 held for future release.]
[Q2-15 previously released.]
[QUESTIONS 16 & 17 WERE ROTATED]
16.Overall, how would you rate the quality of government in New Jersey – is it excellent, good, only fair, or poor?
| Trend: | Jan. 2023 | Dec. 2010 | Aug. 2009 | Sept. 2007 |
|---|---|---|---|---|
| Excellent | 4% | 3% | 2% | 1% |
| Good | 32% | 21% | 25% | 28% |
| Only fair | 41% | 43% | 41% | 44% |
| Poor | 22% | 31% | 30% | 25% |
| (VOL) Don’t know | 0% | 2% | 1% | 2% |
| (n) | (809) | (2,864) | (900) | (801) |
17.How would you rate the quality of government in Washington, D.C. – is it excellent, good, only fair, or poor?
| Response: | Jan. 2023 |
|---|---|
| Excellent | 2% |
| Good | 17% |
| Only fair | 36% |
| Poor | 43% |
| (VOL) Don’t know | 2% |
| (n) | (809) |
18.Which one is better run – the state government in Trenton or the federal government in Washington, or are they about the same?
| Response: | Jan. 2023 |
|---|---|
| State government in Trenton | 29% |
| Federal government in Washington | 9% |
| About the same | 57% |
| (VOL) Don’t know | 5% |
| (n) | (809) |
19.Which of the following two statements do you agree with more: getting involved in politics and government is a dirty business – or – getting involved in politics and government is an honorable thing to do? [CHOICES WERE ROTATED]
| Trend: | Jan. 2023 | Aug. 2009 | Sept. 2008 |
|---|---|---|---|
| Dirty business | 44% | 40% | 32% |
| Honorable thing to do | 44% | 50% | 55% |
| (VOL) Depends/both/neither | 9% | 8% | 8% |
| (VOL) Don’t know | 3% | 3% | 6% |
| (n) | (809) | (900) | (808) |
[QUESTIONS 20 & 21 WERE ROTATED]
20.Have you ever worked either alone or with a group to solve a problem in the community where you live, or have you not had the opportunity to do that? [If YES:Was this in the last 12 months or not?]
| Trend: | Jan. 2023 | Dec. 2010 | Sept. 2008 |
|---|---|---|---|
| Yes, within last 12 months | 20% | 22% | 23% |
| Yes, but not within last 12 months | 31% | 16% | 22% |
| No, haven’t done it | 48% | 62% | 55% |
| (VOL) Don’t know | 1% | 0% | 1% |
| (n) | (809) | (2,864) | (808) |
21.Thinking about the problems you see in your community, how much difference do you believe you personally can make in working to solve problems you see – a great deal, some, a little, or no difference at all?
| Trend: | Jan. 2023 | Dec. 2010 | Sept. 2008 |
|---|---|---|---|
| Great deal | 16% | 12% | 16% |
| Some | 39% | 33% | 32% |
| A little | 24% | 28% | 27% |
| No difference at all | 20% | 25% | 21% |
| (VOL) Don’t know | 1% | 2% | 4% |
| (n) | (809) | (2,864) | (808) |
[Q22-28 previously released.]
[Q29-44 held for future release.]
Methodology
The Monmouth University Poll was sponsored and conducted by the Monmouth University Polling Institute from January 5 to 9, 2023 with a probability-based random sample of 809 New Jersey adults age 18 and older. This includes 286 contacted by a live interviewer on a landline telephone and 523 contacted by a live interviewer on a cell phone, in English. Telephone numbers were selected through random digit dialing and landline respondents were selected with a modified Troldahl-Carter youngest adult household screen. Monmouth is responsible for all aspects of the survey design, data weighting and analysis. The full sample is weighted for region, age, education, gender and race based on US Census information (ACS 2021 one-year survey). Interviewing services were provided by Braun Research, with sample obtained from Dynata. For results based on this sample, one can say with 95% confidence that the error attributable to sampling has a maximum margin of plus or minus 4.7 percentage points (adjusted for sample design effects). Sampling error can be larger for sub-groups (see table below). In addition to sampling error, one should bear in mind that question wording and practical difficulties in conducting surveys can introduce error or bias into the findings of opinion polls.
NJ Regions (by county)
North – Bergen, Essex, Hudson, Morris, Passaic, Sussex, Union, Warren
Central – Hunterdon, Mercer, Middlesex, Monmouth, Somerset
South – Atlantic, Burlington, Camden, Cape May, Cumberland, Gloucester, Ocean, Salem
| DEMOGRAPHICS (weighted) |
| Self-Reported |
| 23% Republican |
| 39% Independent |
| 38% Democrat |
| 49% Male |
| 51% Female |
| 27% 18-34 |
| 34% 35-54 |
| 39% 55+ |
| 55% White |
| 13% Black |
| 20% Hispanic |
| 12% Asian/Other |
| 59% No degree |
| 41% 4 year degree |
Click on pdf file link below for full methodology and crosstabs by key demographic groups.


