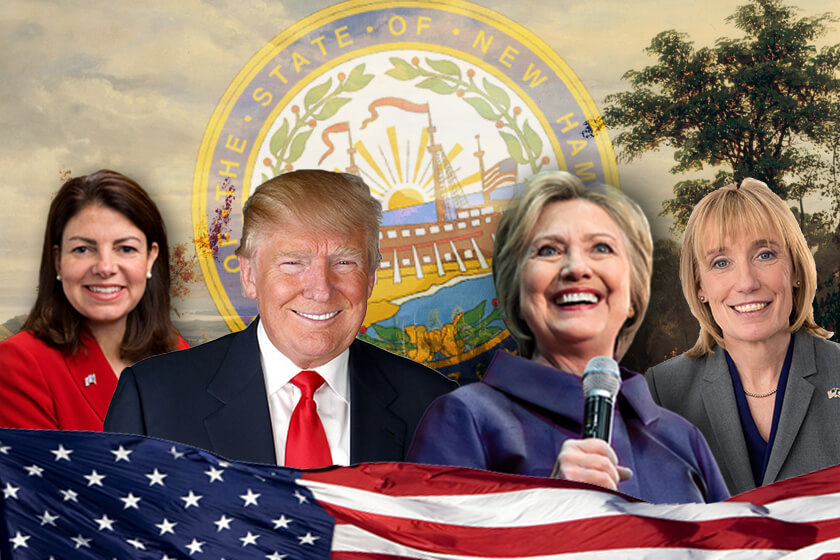
West Long Branch, NJ – Hillary Clinton still leads Donald Trump in New Hampshire, but by a narrower margin than she did last month. Clinton’s current 4 point edge is down from 9 points in September, according to the Monmouth University Poll . The U.S. Senate contest has now moved into a tie from a 2 point Republican advantage last month. In the race for governor, the Democrat has now taken a 5 point lead, overcoming a 6 point deficit in the prior poll.
Among Granite State voters likely to participate in November’s presidential election, 46% support Clinton and 42% back Trump. Another 7% intend to vote for Libertarian Gary Johnson and 1% support Green Party candidate Jill Stein. Clinton led Trump by 47% to 38% in September.
Clinton leads among women (56% to 31%) and voters with a college degree (56% to 34%). These results are similar to Clinton’s advantage with women (56% to 30%) and college graduates (54% to 31%) last month. Trump leads among men (54% to 34%) and voters without a college education (50% to 35%), which is slightly better than his September margins among men (47% to 37%) and non-college graduates (47% to 40%).
“Trump’s support among his base voters has ticked up, but not enough to erase Clinton’s overall advantage,” said Patrick Murray, director of the independent Monmouth University Polling Institute.
New Hampshire voters have a slightly more negative view of Trump than Clinton. Only 28% have a favorable opinion of the Republican nominee while 61% hold an unfavorable view of him. This compares with a 30% favorable and 63% unfavorable rating last month. Slightly more voters (33%) have a favorable opinion of the Democratic nominee while 57% hold an unfavorable view of her. This compares with a 36% favorable and 56% unfavorable rating last month.
Turning to the state’s U.S. Senate race, incumbent Kelly Ayotte and current governor Maggie Hassan are tied at 46% to 46%. One month ago, Ayotte had a small 47% to 45% lead over Hassan. Libertarian Brian Chabot earns 5% of the vote.
The top of the ticket is having an impact on the Senate race, particularly for the Republican candidate. Nearly 3-in-10 voters (29%) say Ayotte has been too supportive of Trump and 24% say she has not been supportive enough. Far fewer voters express similar concerns about Hassan’s support of Clinton, with 21% saying the Democrat has been too supportive of her party’s presidential nominee and only 5% saying she has not been supportive enough.
Voter opinion of both major party nominees has worsened in the heat of the campaign. Overall, 40% of voters have a favorable opinion of Ayotte and 35% have an unfavorable view, compared with a 48% favorable and 32% unfavorable rating last month. Likewise, 40% of voters have a favorable opinion of Hassan and 35% have an unfavorable view, compared with a 47% favorable and 27% unfavorable rating last month.
“This campaign has taken a toll on two politicians who started out as largely popular among their constituents,” said Murray.
The Monmouth University Poll also finds that Democrats have improved their chances of holding onto control of the Granite State governorship. Executive Councilor Colin Van Ostern now has a 48% to 43% lead over fellow councilor Chris Sununu. Sununu, who is the son of a former Republican governor, actually held a 49% to 43% lead in this race just one month ago. Another 4% of New Hampshire voters say they will vote for Libertarian Max Abramson.
The Monmouth University Poll was conducted by telephone from October 22 to 25, 2016 with 401 New Hampshire residents likely to vote in the November election. This sample has a margin of error of ± 4.9 percent. The poll was conducted by the Monmouth University Polling Institute in West Long Branch, NJ.
QUESTIONS AND RESULTS
(* Some columns may not add to 100% due to rounding.)
1/2. If the election for President was today, would you vote for Donald Trump the Republican, Hillary Clinton the Democrat, Gary Johnson the Libertarian, or Jill Stein of the Green Party? [IF UNDECIDED: If you had to vote for one of the following candidates at this moment, who do you lean toward – Donald Trump or Hillary Clinton?] [NAMES WERE ROTATED]
| (with leaners) | Oct. 2016 | Sept. 2016 |
| Donald Trump | 42% | 38% |
| Hillary Clinton | 46% | 47% |
| Gary Johnson | 7% | 10% |
| Jill Stein | 1% | 1% |
| (VOL) Other candidate | 1% |
<1% |
| (VOL) Undecided | 4% | 3% |
| (n) | (401) | (400) |
3. If the election for U.S. Senate was today, would you vote for Kelly Ayotte the Republican, Maggie Hassan the Democrat, or Brian Chabot the Libertarian? [IF UNDECIDED: If you had to vote for one of the following candidates at this moment, who do you lean toward – Kelly Ayotte or Maggie Hassan?] [NAMES WERE ROTATED]
| (with leaners) | Oct. 2016 | Sept. 2016 |
| Kelly Ayotte | 46% | 47% |
| Maggie Hassan | 46% | 45% |
| Brian Chabot | 5% | 2% |
| (VOL) Other candidate | 1% | <1% |
| (VOL) Undecided | 2% | 5% |
| (n) | (401) | (400) |
4. If the election for governor was today, would you vote for Chris Sununu the Republican, Colin Van Ostern the Democrat, or Max Abramson the Libertarian? [IF UNDECIDED: If you had to vote for one of the following candidates at this moment, who do you lean toward – Chris Sununu or Colin Van Ostern?] [NAMES WERE ROTATED]
| (with leaners) | Oct. 2016 | Sept. 2016 |
| Chris Sununu | 43% | 49% |
| Colin Van Ostern | 48% | 43% |
| Max Abramson | 4% | 1% |
| (VOL) Other candidate |
<1% |
<1% |
| (VOL) Undecided | 5% | 7% |
| (n) | (401) | (400) |
Regardless of who you may support…
[QUESTIONS 5 & 6 WERE ROTATED]
5. Is your general impression of Donald Trump favorable or unfavorable, or do you have no opinion of him?
| Oct. 2016 | Sept. 2016 | |
| Favorable | 28% | 30% |
| Unfavorable | 61% | 63% |
| No opinion | 11% | 7% |
| (n) | (401) | (400) |
6. Is your general impression of Hillary Clinton favorable or unfavorable, or do you have no opinion of her?
| Oct. 2016 | Sept. 2016 | |
| Favorable | 33% | 36% |
| Unfavorable | 57% | 56% |
| No opinion | 10% | 8% |
| (n) | (401) | (400) |
[QUESTIONS 7 & 8 WERE ROTATED]
7. Is your general impression of Kelly Ayotte favorable or unfavorable, or do you have no opinion of her?
| Oct. 2016 | Sept. 2016 | |
| Favorable | 40% | 48% |
| Unfavorable | 35% | 32% |
| No opinion | 24% | 20% |
| (n) | (401) | (400) |
8. Is your general impression of Maggie Hassan favorable or unfavorable, or do you have no opinion of her?
| Oct. 2016 | Sept. 2016 | |
| Favorable | 40% | 47% |
| Unfavorable | 35% | 27% |
| No opinion | 25% | 26% |
| (n) | (401) | (400) |
[QUESTIONS 9 & 10 WERE ROTATED]
9. Has Kelly Ayotte been too supportive of Donald Trump, not supportive enough, or has she given the right amount of support to Trump?
| Oct. 2016 | |
| Too supportive | 29% |
| Not supportive enough | 24% |
| Right amount of support | 28% |
| (VOL) Don’t know | 19% |
| (n) | (401) |
10. Has Maggie Hassan been too supportive of Hillary Clinton, not supportive enough, or has she given the right amount of support to Clinton?
| Oct. 2016 | |
| Too supportive | 21% |
| Not supportive enough | 5% |
| Right amount of support | 48% |
| (VOL) Don’t know | 27% |
| (n) | (401) |
METHODOLOGY
The Monmouth University Poll was sponsored and conducted by the Monmouth University Polling Institute from October 22 to 25, 2016 with a random sample of 401 likely New Hampshire voters. Interviews were conducted by a live caller in English, including 351 drawn from a list of registered voters (201 landline / 150 cell phone) and a random digit dial supplement of 50 cell phone interviews. Monmouth is responsible for all aspects of the survey design, data weighting and analysis. The final sample is weighted for age, gender, race and partisanship based on voter list and U.S. Census information. Data collection support provided by Braun Research (field), Aristotle (voter list sample), and SSI (RDD sample). For results based on this sample, one can say with 95% confidence that the error attributable to sampling has a maximum margin of plus or minus 4.9 percentage points (unadjusted for sample design). Sampling error can be larger for sub-groups (see table below). In addition to sampling error, one should bear in mind that question wording and practical difficulties in conducting surveys can introduce error or bias into the findings of opinion polls.
| DEMOGRAPHICS (weighted) |
| Self-Reported |
| 25% Republican |
| 51% Independent |
| 23% Democrat |
| 47% Male |
| 53% Female |
| 18% 18-34 |
| 25% 35-49 |
| 32% 50-64 |
| 24% 65+ |
| 95% White |
| 1% Black |
| 2% Hispanic |
| 2% Other |
Click on pdf file link below for full methodology and results by key demographic groups.


