
West Long Branch, NJ – The race for Pennsylvania’s electoral votes is tight, with Vice President Kamala Harris holding slightly more support than former President Donald Trump in the 2024 race for president. Inflation is a dominant issue in the race, according to the Monmouth (“Mon-muth”) University Poll, but so are economic growth, abortion, and immigration . The mix of specific issues that are seen as important to individual voters correlates highly with their vote choice.
Out of five issue areas included in the poll, inflation is named as the top or second most important issue by 62% of Pennsylvania voters. Just under half (45%) name economic growth and jobs as one of their top two issues, 40% say the same about abortion and reproductive policy and 38% say the same about immigration. Just 11% name crime as one of the top two issues influencing their vote this year.
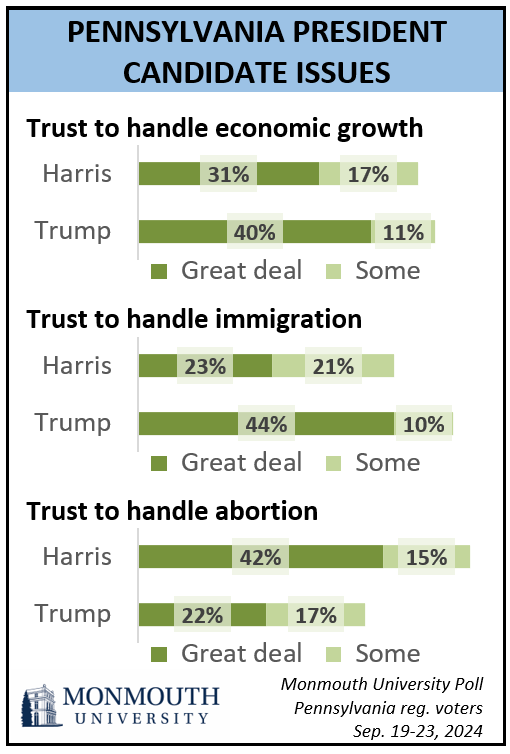
Voters are almost evenly split between Trump (51%) and Harris (48%) on trusting each to handle the issue of economic growth. Trump (54%) has more of an edge over Harris (44%) on handling immigration while Harris (57%) has a sizable advantage over Trump (39%) on abortion among all Pennsylvania voters.
The poll finds that 18% of voters name both inflation and economic growth as top issues in this election. Among this group, 50% are currently supporting Trump and 36% are backing Harris. Another 44% name inflation, but not growth, as a top issue for them. It is a similar story with this inflation-only priority group, with 54% supporting Trump and 39% backing Harris. Among the 27% of voters who name growth but not inflation as a top issue, however, Harris (66%) has a large advantage over Trump (26%) in electoral support. Harris also has a small edge (50% to 45% for Trump) among those voters – representing 11% of the electorate – who say neither inflation nor growth are important issues in this race.
“Donald Trump does well on the dominant issue in this race. But inflation isn’t necessarily a concern for every voter. Kamala Harris has a particularly large advantage among those who do not prioritize inflation which offsets Trump’s support among voters who prioritize this issue,” said Patrick Murray, director of the independent Monmouth University Polling Institute.
Another pair of issues – abortion and immigration – provides an even greater differentiation between backers of the two major party candidates. Just 5% say both issues are top electoral concerns for them, while 35% say only abortion is and 33% say only immigration is. Another 27% do not name either issue as being among their top priorities in this election. Among those who name abortion as a top issue, 87% back Harris and just 4% choose Trump. Among those who name immigration as a top issue, 87% back Trump and just 7% choose Harris. Among those who name neither issue as a top priority, Trump has 46% support and Harris has 41%.
“It’s not about a policy debate when it comes to abortion and immigration. These two issues really act as visible markers that signal which side you are on. If you are talking about abortion you are almost certainly aligned with the Democrats. If you say you are concerned about immigration, you are almost certainly a Republican voter,” said Murray.
Overall, just under half of registered voters in Pennsylvania say they will either definitely (40%) or probably (8%) vote for Harris in November and, in a separate question, a similar number will definitely (38%) or probably (7%) support Trump. Nearly identical numbers say they will definitely not vote for Trump (46%) or Harris (44%).
Monmouth also asked about potential support for third-party candidates in the presidential race. Just 2% of Pennsylvania voters say they will definitely support one of these candidates while another 2% say they will probably support one of these candidates. The third-party factor shaves about one percentage point off Harris’s total support while leaving Trump’s support basically intact.
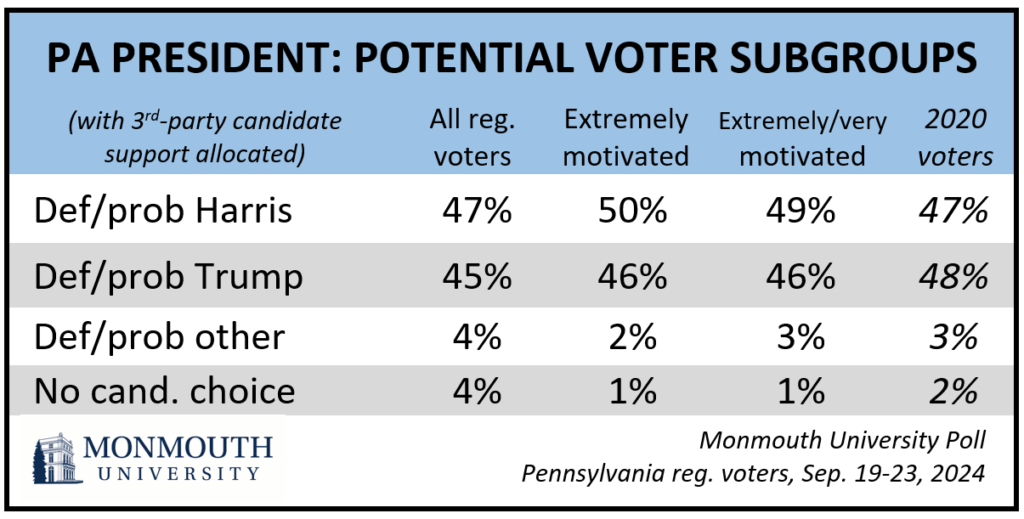
The poll was conducted among Pennsylvania registered voters, but not all of them will actually vote. If the electorate is identical to turnout from the 2020 election, then the race will be just as tight as it was four years ago. Specifically, among those who were validated as having voted in the 2020 election according to the registration list, Trump has 48% support and Harris has 47%. In 2020, Trump lost the commonwealth by a single point to now-President Joe Biden.
The race could shift in Harris’s favor when examining a key turnout metric – motivation. Voters who describe themselves as extremely motivated to cast a ballot this year represent three-quarters (75%) of all registered voters. Among this motivated group, Harris has 50% definite or probable support and Trump has 46% support. Third-party candidate backing drops to 2% among extremely motivated voters and the proportion of the motivated electorate who can be described as undecided – meaning they do not lean toward any candidate – is only 1%.
“It’s important to remember that a single percentage point in the Pennsylvania race represents about 70,000 voters. That number is too small to be captured precisely by the polls, but increasing turnout by even that small amount could end up being the whole ball game,” said Murray.
The poll does not find much of a gender gap among Pennsylvania voters in their presidential vote intent, with similar levels of support for Harris (47% women and 48% men) and Trump (46% women and 45% men). There is more of a differentiation by voter age groups, with Harris having greater support among those under 50 years old (50% to 40% for Trump). Harris also has a slight edge among voters age 65 and older (51% to 46% for Trump). Trump’s best age group is voters between 50 and 64 years old (54% to 42% for Harris).
Regionally, Trump is doing well in the reddest parts of Pennsylvania. In the western and central parts of the commonwealth, including Amish country but excluding Allegheny County, he has 54% support compared with 41% for Harris. Combining Philadelphia with its four surrounding suburban counties shows Harris with 58% support and Trump with 34% in that region. Trump’s current poll support is about the same as the vote share he got in the 2020 election, but Harris’s support is about 8 points lower than what Biden received in the Philadelphia metro area four years ago.
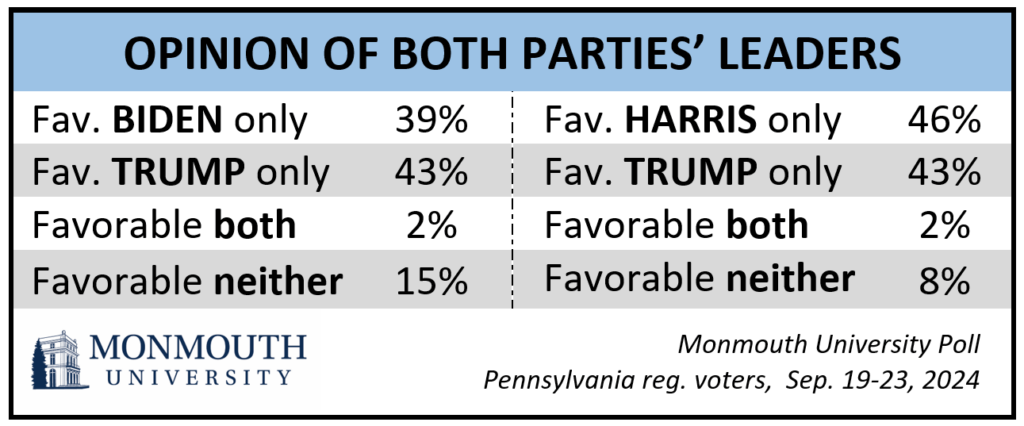
The poll finds that Harris has higher favorable ratings than Biden. Overall, 49% have a favorable opinion of the vice president while just 41% hold a favorable view of the president. Trump’s personal rating of 45% favorable is better than Biden’s but worse than Harris’s.
In other poll findings, just over 7 in 10 voters are either very (45%) or somewhat (27%) confident that the 2024 election in Pennsylvania will be conducted fairly and accurately. Those who are confident include 97% of Democrats and 69% of independents, but only 50% of Republicans. Four years ago, a slightly smaller number was confident in the fair and accurate conduct of that year’s election, including just 20% who were very confident and 40% who were somewhat confident in October 2020. There was less variation among the views of Democrats (71%), independents (60%), and Republicans (50%) four years ago than there is today.
The Monmouth University Poll was conducted by telephone and online from September 19 to 23, 2024 with 654 Pennsylvania registered voters. The question results in this release have a margin of error +/- 4.5 percentage points. The poll was conducted by the Monmouth University Polling Institute in West Long Branch, NJ.
QUESTIONS AND RESULTS
(* Some columns may not add to 100% due to rounding.)
[QUESTIONS 1 & 2 WERE ROTATED]
1.Is your general impression of Donald Trump very favorable, somewhat favorable, somewhat unfavorable, or very unfavorable?
| Registered voters | Sept. 2024 |
|---|---|
| Very favorable | 34% |
| Somewhat favorable | 11% |
| Somewhat unfavorable | 7% |
| Very unfavorable | 47% |
| (VOL) No opinion | 1% |
| (n) | (654) |
2.Is your general impression of Kamala Harris very favorable, somewhat favorable, somewhat unfavorable, or very unfavorable?
| Registered voters | Sept. 2024 |
|---|---|
| Very favorable | 34% |
| Somewhat favorable | 15% |
| Somewhat unfavorable | 8% |
| Very unfavorable | 42% |
| (VOL) No opinion | 1% |
| (n) | (654) |
3.Is your general impression of Joe Biden very favorable, somewhat favorable, somewhat unfavorable, or very unfavorable?
Trend: Registered voters | Sept. 2024 |
|---|---|
| Very favorable | 19% |
| Somewhat favorable | 22% |
| Somewhat unfavorable | 12% |
| Very unfavorable | 47% |
| (VOL) No opinion | 0% |
| (n) | (654) |
[QUESTIONS 4 & 5 WERE ROTATED]
Looking ahead to the November election…
4.How likely are you to vote for Donald Trump in the election for president – will you definitely vote for him, probably vote for him, probably not vote for him, or definitely not vote for him?
| Registered voters | Sept. 2024 |
|---|---|
| Definitely | 38% |
| Probably | 7% |
| Probably not | 7% |
| Definitely not | 46% |
| (VOL) Don’t know | 1% |
| (n) | (654) |
5.How likely are you to vote for Kamala Harris in the election for president – will you definitely vote for her, probably vote for her, probably not vote for her, or definitely not vote for her?
| Registered voters | Sept. 2024 |
|---|---|
| Definitely | 40% |
| Probably | 8% |
| Probably not | 6% |
| Definitely not | 44% |
| (VOL) Don’t know | 2% |
| (n) | (654) |
6.How likely are you to vote for one of the third party candidates for president, either Chase Oliver the Libertarian candidate or Jill Stein the Green Party candidate – will you definitely vote for a third party candidate, probably vote third party, probably not vote third party, or definitely not vote for a third party candidate?
| Registered voters | Sept. 2024 |
|---|---|
| Definitely | 2% |
| Probably | 2% |
| Probably not | 17% |
| Definitely not | 77% |
| (VOL) Don’t know | 3% |
| (n) | (654) |
[Q7-13 held for future release.]
14.Of the following five issues, which one is most important to your vote for President and U.S. Senate this year? And which issue is the second most important? [READ ITEM] [ITEMS WERE ROTATED]
| Registered voters | First Choice | Second Choice | Combined 1 & 2 |
|---|---|---|---|
| Economic growth and jobs | 21% | 24% | 45% |
| Inflation and the price of goods and services | 31% | 31% | 62% |
| Immigration | 19% | 19% | 38% |
| Crime | 2% | 9% | 11% |
| Abortion and reproductive policy | 26% | 14% | 40% |
| (VOL) Don’t know | 2% | 3% | n/a |
| (n) | (654) | (654) | (654) |
[QUESTIONS 15A & 15B WERE ROTATED]
Focusing on the candidates for president…
15A.How much do you trust Donald Trump to handle the issue of economic growth – a great deal, some, not much, or not at all?
| Registered voters | Sept. 2024 |
|---|---|
| Great deal | 40% |
| Some | 11% |
| Not much | 7% |
| Not at all | 41% |
| (VOL) Don’t know | 0% |
| (n) | (654) |
15B.How much do you trust Kamala Harris to handle the issue of economic growth – a great deal, some, not much, or not at all?
| Registered voters | Sept. 2024 |
|---|---|
| Great deal | 31% |
| Some | 17% |
| Not much | 8% |
| Not at all | 43% |
| (VOL) Don’t know | 0% |
| (n) | (654) |
[QUESTIONS 16A & 16B WERE ROTATED]
16A.How much do you trust Donald Trump to handle the issue of immigration – a great deal, some, not much, or not at all?
| Registered voters | Sept. 2024 |
|---|---|
| Great deal | 44% |
| Some | 10% |
| Not much | 7% |
| Not at all | 38% |
| (VOL) Don’t know | 0% |
| (n) | (654) |
16B.How much do you trust Kamala Harris to handle the issue of immigration – a great deal, some, not much, or not at all?
| Registered voters | Sept. 2024 |
|---|---|
| Great deal | 23% |
| Some | 21% |
| Not much | 7% |
| Not at all | 48% |
| (VOL) Don’t know | 0% |
| (n) | (654) |
[QUESTIONS 17A & 17B WERE ROTATED]
17A.How much do you trust Donald Trump to handle the issue of abortion – a great deal, some, not much, or not at all?
| Registered voters | Sept. 2024 |
|---|---|
| Great deal | 22% |
| Some | 17% |
| Not much | 9% |
| Not at all | 47% |
| (VOL) Don’t know | 4% |
| (n) | (654) |
17B.How much do you trust Kamala Harris to handle the issue of abortion – a great deal, some, not much, or not at all?
| Registered voters | Sept. 2024 |
|---|---|
| Great deal | 42% |
| Some | 15% |
| Not much | 9% |
| Not at all | 30% |
| (VOL) Don’t know | 4% |
| (n) | (654) |
[Q18-20 held for future release.]
A few questions on the November election in general…
21.Overall, how confident are you that the 2024 election in Pennsylvania will be conducted fairly and accurately – very confident, somewhat confident, not too confident, or not at all confident?
| Registered voters | Sept. 2024 |
|---|---|
| Very confident | 45% |
| Somewhat confident | 27% |
| Not too confident | 17% |
| Not at all confident | 12% |
| (VOL) Don’t know | 0% |
| (n) | (654) |
22.How motivated are you to vote in this year’s election – extremely motivated, very motivated, somewhat motivated, or not motivated?
| Registered voters | Sept. 2024 |
|---|---|
| Extremely motivated | 75% |
| Very motivated | 12% |
| Somewhat motivated | 8% |
| Not motivated | 4% |
| (n) | (654) |
[Q23-24 held for future release.]
25.Did you vote in the 2020 presidential election, or did you not vote for whatever reason? [If YES:] Who did you vote for – Donald Trump, Joe Biden, or another candidate? [NAMES WERE ROTATED]
| Sept. 2024 | Sept. 2024 | |
|---|---|---|
| Registered voters | All recalled reports | Validated 2020 voters only |
| Donald Trump | 40% | 46% |
| Joe Biden | 46% | 47% |
| Another candidate | 3% | 2% |
| Voted, did not name candidate | 1% | 2% |
| Did not vote | 9% | 3% |
| (n) | (654) | (534) |
METHODOLOGY
The Monmouth University Poll was sponsored and conducted by the Monmouth University Polling Institute from September 19 to 23, 2024 with a probability-based random sample of 654 Pennsylvania voters. Monmouth is responsible for all aspects of the survey design, data weighting and analysis. Interviews were conducted in English, and included 111 live landline telephone interviews, 182 live cell phone interviews, and 361 online surveys via a cell phone text invitation. Interviewing services were provided by Braun Research using telephone numbers randomly selected from a list of active registered voters obtained from Aristotle. The full sample is weighted for region, age, gender, race and listed partisanship based on the voter list and education based on US Census information (2022 CPS and 2021 ACS one-year surveys), with adjustments made for self-reported 2020 presidential vote. For results based on this sample, one can say with 95% confidence that the error attributable to sampling has a maximum margin of plus or minus 4.5 percentage points adjusted for sample design effects (1.36). Sampling error can be larger for sub-groups (see table below). In addition to sampling error, one should bear in mind that question wording and practical difficulties in conducting surveys can introduce error or bias into the findings of opinion polls.
Demographics (weighted)
Party (registration): 42% Republican, 44% Democrat, 14% other, none
Party (self-reported): 36% Republican, 29% Independent, 35% Democrat
Sex: 47% men, 52% women, 1% other
Age: 23% 18-34, 23% 35-49, 26% 50-64, 28% 65+
Race: 82% White, 10% Black, 5% Hispanic, 3% Asian/other
Education: 37% high school or less, 25% some college, 23% 4 year degree, 15% graduate degree
Region: 11% Philadelphia, 22% Philly suburbs, 15% Northeast, 17% PA Dutch,
11% Central, 14% Western, 10% Allegheny
Click on pdf file link below for full methodology and crosstabs by key demographic groups.