West Long Branch, NJ – A majority of New Jerseyans back a ban on single-use plastic bags, although that support has dipped by a few points since the rules went into effect last year. There have been similar small declines in support for bans on other bags and containers, according to the latest Monmouth (“Mon-muth”) University Poll. State residents report most, but not necessarily all, New Jersey stores are abiding by the ban and a majority say that they have accumulated ten or more reusable bags in the past year.

Overall, 45% of New Jerseyans say, based on their own experience, all stores in the state are following the plastic bag ban and another 45% say most stores are. Thinking about the last time they went to a New Jersey deli or restaurant for takeout in the last six months, just 11% say they received their order in a plastic bag, while 53% were given a paper bag and 29% did not get any bag. Nine in ten New Jerseyans (89%) bring their own bags when they go grocery shopping, which is up from 38% who reported doing this in a poll taken a month before the ban went into effect last year. About 1 in 10 residents (9%), though, remain unaware that the state has instituted a plastic bag ban.
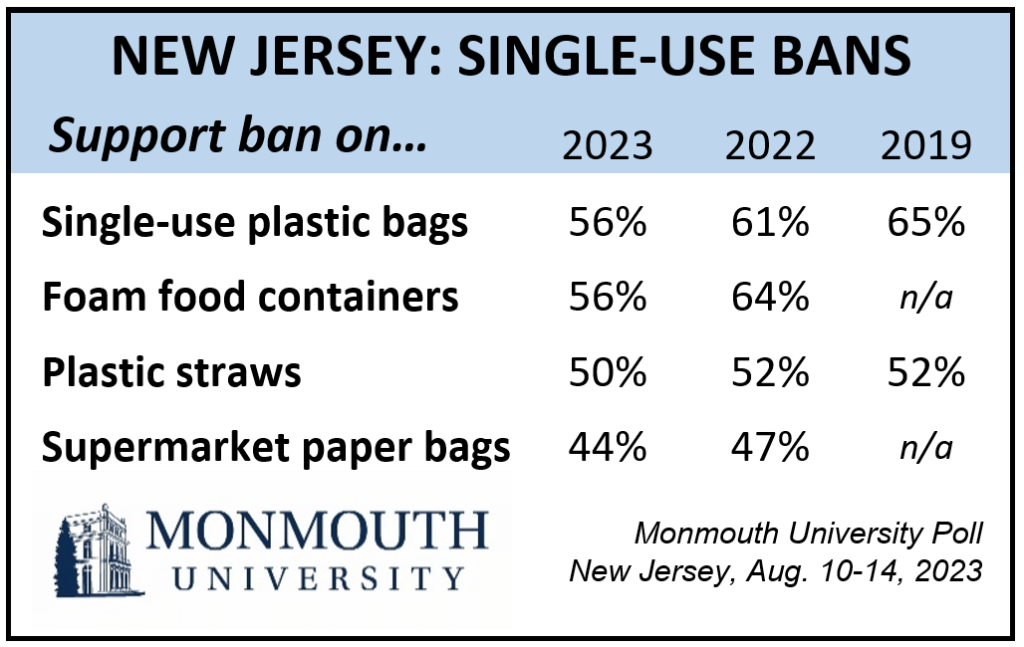
A majority of New Jerseyans continue to support a ban on single-use plastic bags (56%) although this is a few points lower than shortly before the ban went into effect (61% in April 2022). A similar majority (56%) supports banning Styrofoam food containers, but this is also slightly lower than last year (64%). Less than half (44%) of the public supports banning large supermarkets from giving out paper bags, as the law now requires. This result is down three points from 2022 (47%).
“There has been a small dip in support since the state’s plastic bag ban went into effect, but most New Jerseyans are still on board with it,” said Patrick Murray, director of the independent Monmouth University Polling Institute.
More than 7 in 10 Democrats (72%) back the plastic bag ban, which is identical to the 2022 poll results. However, support has dropped among independents (from 62% to 52%) and Republicans (from 44% to 39%). On the other hand, support for banning Styrofoam containers has declined among Democrats (from 73% to 65%) and independents (from 66% to 54%), but remained basically steady among Republicans (from 49% to 51%). While Democrats are more likely than Republicans to support the plastic bag and foam container bans, there is no significant difference in partisan opinion on prohibiting supermarkets from giving out paper bags. Support for the paper bag ban now stands at 49% of Democrats and 43% of Republicans, which is a few points lower for both partisan groups since last year. Support among independents (42%) has remained stable.

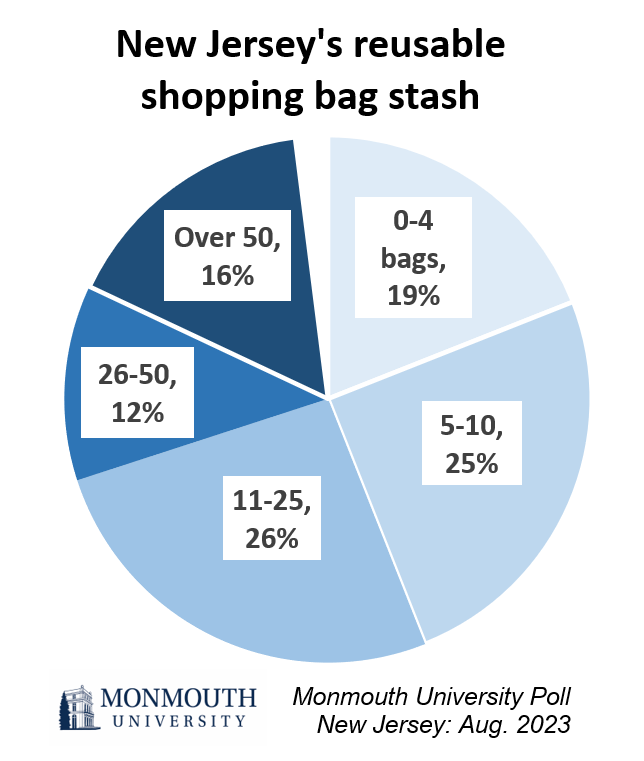
With so many New Jerseyans using their own bags, the poll also asked how many reusable shopping bags they have acquired over the past year, including those purchased and others they were given at stores or with food deliveries. A majority of residents report accumulating more than ten bags, with 16% saying they have gotten more than 50 reusable bags, 12% who got between 26 and 50 bags, and 26% who got between 11 and 25 bags.
Those who have gotten more than five bags were asked what they do with their surplus. Most New Jerseyans (62%) keep their extra bags, 20% recycle some of them, and 7% throw at least some in the trash. The latter numbers go up among those who have accumulated more than 25 bags for both recycling (35%) and disposal (15%) of their extra bags.
“Fewer single-use bags are making their way into the waste stream, but we now face a growing stockpile of reusable bags that New Jerseyans don’t know what to do with,” said Murray.
Current support for a plastic straw ban stands at 50%, which is similar to last year (52%). Plastic straws are available only by request under state regulations that went into effect in 2021. One-quarter of New Jerseyans (25%) report they were given a plastic straw when they last purchased a drink in a cup at a food establishment in the state. Another 45% received a paper straw and 23% did not get any straw.
The Monmouth University Poll was conducted by telephone from August 10 to 14, 2023 with 814 New Jersey adults. The question results in this release have a margin of error of +/- 5.4 percentage points for the full sample. The poll was conducted by the Monmouth University Polling Institute in West Long Branch, NJ.
QUESTIONS AND RESULTS
(* Some columns may not add to 100% due to rounding.)
[Q1 & 13-16 held for future release.]
[Q2-12 & 17-24 previously released.]
25.Think about the last time you went to a deli or restaurant in New Jersey within the past six months to purchase food for takeout. Did they give you a plastic bag, a paper bag, or no bag at all?
| Response: | Aug. 2023 |
|---|---|
| Plastic bag | 11% |
| Paper bag | 53% |
| No bag | 29% |
| (VOL) Other bag/container | 3% |
| (VOL) No deli/takeout | 2% |
| (VOL) Don’t know | 2% |
| (n) | (814) |
26.Now, think about the last time you went to a food establishment in New Jersey within the past six months where you got a drink in a cup. Did they give you a plastic straw, a paper straw, or no straw at all?
| Response: | Aug. 2023 |
|---|---|
| Plastic straw | 25% |
| Paper straw | 45% |
| No straw | 23% |
| (VOL) No drink out | 4% |
| (VOL) Don’t know | 3% |
| (n) | (814) |
27.When you go grocery shopping, do you generally bring your own bags, do you use single-use plastic bags provided by the store, or do you use paper bags provided by the store at checkout? [If MIXED or DEPENDS: What do you use most of the time?]
| Trend: | Aug. 2022 | April 2022 |
|---|---|---|
| Bring own bags | 89% | 38% |
| Store’s plastic bags | 1% | 50% |
| Store’s paper bags | 3% | 10% |
| (VOL) Do not use any bags | 4% | n/a |
| (VOL) Purchase reusable | 3% | n/a |
| (VOL) Do not shop | 0% | 1% |
| (VOL) Don’t know | 1% | 1% |
| (n) | (814) | (802) |
28.Do you support or oppose banning single-use plastic bags in New Jersey, such as those given out at supermarkets or other stores?
| Trend: | Aug. 2023 | April 2022* | Sept. 2019** |
|---|---|---|---|
| Support | 56% | 61% | 65% |
| Oppose | 42% | 37% | 29% |
| (VOL) Don’t know | 2% | 2% | 7% |
| (n) | (814) | (802) | (713) |
[QUESTIONS 29-31 WERE ROTATED]
29.Do you support or oppose banning large supermarkets from giving out paper shopping bags?
| Trend: | Aug. 2023 | April 2022* |
|---|---|---|
| Support | 44% | 47% |
| Oppose | 53% | 51% |
| (VOL) Don’t know | 3% | 2% |
| (n) | (814) | (802) |
30.Do you support or oppose banning takeout food containers and cups that are made out of polystyrene, commonly known as Styrofoam?
| Trend: | Aug. 2023 | April 2022* |
|---|---|---|
| Support | 56% | 64% |
| Oppose | 39% | 33% |
| (VOL) Don’t know | 5% | 3% |
| (n) | (814) | (802) |
31.Do you support or oppose banning plastic straws in New Jersey?
| Trend: | Aug. 2023 | April 2022* | Sept. 2019** |
|---|---|---|---|
| Support | 50% | 52% | 52% |
| Oppose | 47% | 45% | 44% |
| (VOL) Don’t know | 3% | 3% | 4% |
| (n) | (814) | (802) | (713) |
** Question wording in 2019 was “Would you support or oppose a ban on…”
32.Stores in New Jersey are no longer allowed to give out single-use plastic bags. This applies to all stores, including supermarkets, clothing and home goods stores, pharmacies and food establishments. Were you aware of this rule, or were you not aware of this before now?
| Response: | Aug. 2023 |
|---|---|
| Aware | 91% |
| Not aware | 9% |
| (n) | (814) |
33.Based on your experience, how many New Jersey stores are following the plastic bag ban – all of them, most of them, about half of them, or just a few of them?
| Response: | Aug. 2023 |
|---|---|
| All | 45% |
| Most | 45% |
| About half | 7% |
| Just a few | 2% |
| (VOL) None | 1% |
| (VOL) Don’t know | 2% |
| (n) | (814) |
34.Over the past year, about how many reusable shopping bags have you gotten, including those you purchased yourself and those that were given to you at stores or with food deliveries? Would you say less than 5, between 5 and 10, between 11 and 25, between 26 and 50, or more than 50?
| Response: | Aug. 2023 |
|---|---|
| Less than 5 | 17% |
| Between 5 and 10 | 25% |
| Between 11 and 25 | 26% |
| Between 26 and 50 | 12% |
| More than 50 | 16% |
| (VOL) None | 2% |
| (VOL) Don’t know | 1% |
| (n) | (814) |
34A.[If more than 5 bags] What do you do with the extra reusable bags you get – do you keep them, recycle them, or throw them in the trash? [Note: Results add to more than 100% because multiple responses were accepted]
| Response: | Aug. 2023 |
|---|---|
| Keep them | 62% |
| Recycle them | 20% |
| Throw in trash | 7% |
| (VOL) Donate/give away | 2% |
| (VOL) Don’t know | 1% |
| Less than 5 bags (Q34) | 19% |
| (n) | (814) |
[Q35-47 previously released.]
Methodology
The Monmouth University Poll was sponsored and conducted by the Monmouth University Polling Institute from August 10 to 14, 2023 with a probability-based random sample of 814 New Jersey adults age 18 and older. Interviews were conducted in English, and included 245 live landline telephone interviews, 360 live cell phone interviews, and 209 online surveys via a cell phone text invitation. Telephone numbers were selected through random digit dialing and landline respondents were selected with a modified Troldahl-Carter youngest adult household screen. Monmouth is responsible for all aspects of the survey design, data weighting and analysis. The full sample is weighted for region, age, education, gender and race based on US Census information (ACS 2021 one-year survey). Interviewing services were provided by Braun Research, with sample obtained from Dynata. For results based on this sample, one can say with 95% confidence that the error attributable to sampling has a maximum margin of plus or minus 5.4 percentage points adjusted for sample design effects (1.56). Sampling error can be larger for sub-groups (see table below). In addition to sampling error, one should bear in mind that question wording and practical difficulties in conducting surveys can introduce error or bias into the findings of opinion polls.
NJ Regions (by county)
North – Bergen, Essex, Hudson, Morris, Passaic, Sussex, Union, Warren
Central – Hunterdon, Mercer, Middlesex, Monmouth, Somerset
South – Atlantic, Burlington, Camden, Cape May, Cumberland, Gloucester, Ocean, Salem
Demographics (weighted)
Party (self-reported): 22% Republican, 43% Independent, 35% Democrat
Sex: 49% Male, 51% Female
Age: 27% 18-34, 34% 35-54, 39% 55+
Race: 55% White, 13% Black, 19% Hispanic, 13% Asian/Other
College: 58% No degree, 42% 4 year degree
Click on pdf file link below for full methodology and crosstabs by key demographic groups.


