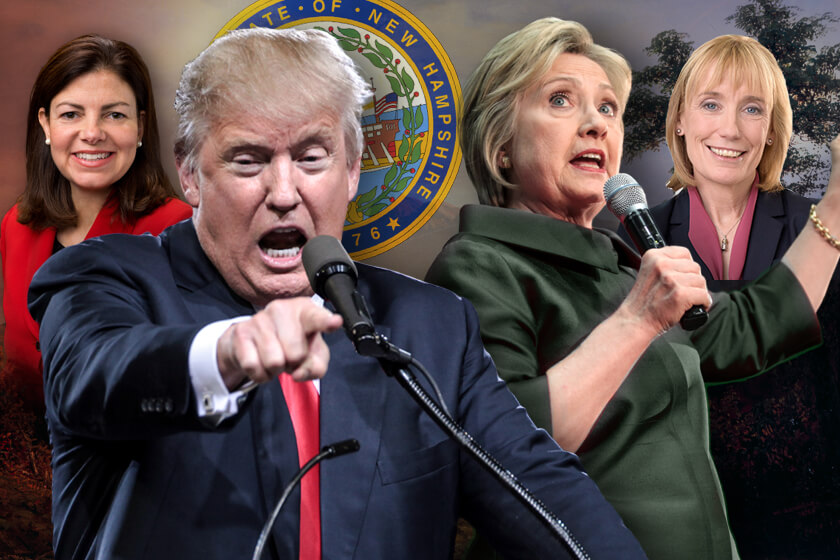
West Long Branch, NJ – New Hampshire may have been the scene of a big win for Donald Trump and an embarrassing loss for Hillary Clinton in the primaries, but the table appears to have been turned for the general election. Clinton has a 9 point lead in the smallest of the battleground states, according to the Monmouth University Poll . Democrats may also be within reach of picking up the GOP-held Senate seat here in a race that is basically tied at this point. Republicans are in a slightly better position for taking over the governorship.
Among Granite State voters likely to participate in November’s presidential election, 47% support Clinton and 38% back Trump. Another 10% intend to vote for Libertarian Gary Johnson, 1% support Green Party candidate Jill Stein, and 3% are currently undecided.
Clinton has the support of 94% of self-identified Democrats while Trump gets the backing of 85% of Republicans. Clinton edges Trump among the state’s sizable bloc of independents by 42% to 35%.
Clinton has the advantage among voters under 50 years old (45% to 35%) as well as those age 50 and older (49% to 41%). Clinton leads among women (56% to 30%) and voters with a college degree (54% to 31%). Trump leads among men (47% to 37%) and voters without a college education (47% to 40%).
“How fortunes have changed for Clinton and Trump in New Hampshire compared to when this campaign started in February,” said Patrick Murray, director of the independent Monmouth University Polling Institute.
New Hampshire voters have a more negative view of Trump than Clinton. Only 30% have a favorable opinion of the Republican nominee while 63% hold an unfavorable view of him. Somewhat more voters (36%) have a favorable opinion of the Democratic nominee while 56% hold an unfavorable view of her. Clinton also has the edge on handling the economy and jobs – 51% of voters trust her more to deal with this issue while 42% prefer Trump.
Most Granite State voters (86%) have heard about Trump’s recent admission that Barack Obama was born in the United States, but they doubt the GOP nominee’s sincerity. Only 29% think that Trump actually believes Obama is a natural born citizen, while 51% say Trump only made the statement for political reasons.
Trump also implicated Hillary Clinton in starting the birther controversy back in 2008. A majority of New Hampshire voters (52%) do not believe she had a role in it, while just 29% say she did. While most voters (80%) say this recent flap will have no impact on their vote, 15% say Trump’s statement makes them less likely to vote for him and just 3% say it makes them more likely.
Turning to the state’s U.S. Senate race, incumbent Kelly Ayotte is in a neck-and-neck race with current governor Maggie Hassan. Currently, Republican Ayotte has 47% support and Democrat Hassan has 45%, with Libertarian Brian Chabot getting 2% and another 5% who are undecided. This race is a key contest in the battle for control of the Senate.
More voters have a favorable (48%) rather than unfavorable (32%) opinion of Ayotte. The results are similar for Hassan at 47% favorable and 27% unfavorable. Hassan has a better job performance rating, although it is for a different job than the one she is currently seeking. Fully 60% of New Hampshire voters approve of the job the Democrat is currently doing as their governor while only 31% disapprove. A somewhat smaller number of voters (50%) approve of the job the Republican is currently doing as their U.S. Senator while 38% disapprove.
“The challenger is finding that high ratings in her current job as governor do not give her an automatic advantage over the incumbent senator,” said Murray.
The GOP’s prospects are slightly better in the race to succeed Hassan in the State House. Currently, Chris Sununu, the son of a former governor, holds a 49% to 43% lead over his fellow Executive Councilor Colin Van Ostern. Another 1% of New Hampshire voters support Libertarian Max Abramson and 7% are undecided.
The Republican, with the well-known last name, is somewhat more familiar to voters than his Democratic opponent. Currently, 36% of voters have a favorable opinion of Sununu, 22% hold an unfavorable view, and 41% have no opinion of him. Fewer voters hold either a favorable (28%) or unfavorable (6%) view of Van Ostern, while 66% have no set opinion of him.
The Monmouth University Poll was conducted by telephone from September 17 to 20, 2016 with 400 New Hampshire residents likely to vote in the November election. This sample has a margin of error of ± 4.9 percent. The poll was conducted by the Monmouth University Polling Institute in West Long Branch, NJ.
QUESTIONS AND RESULTS
(* Some columns may not add to 100% due to rounding.)
1/2. If the election for President was today, would you vote for Donald Trump the Republican, Hillary Clinton the Democrat, Gary Johnson the Libertarian, or Jill Stein of the Green Party? [IF UNDECIDED: If you had to vote for one of the following candidates at this moment, who do you lean toward – Donald Trump or Hillary Clinton?] [NAMES WERE ROTATED]
| (with leaners) | Sept. 2016 |
| Donald Trump | 38% |
| Hillary Clinton | 47% |
| Gary Johnson | 10% |
| Jill Stein | 1% |
| (VOL) Other candidate | <1% |
| (VOL) Undecided | 3% |
| (n) | (400) |
3. If the election for U.S. Senate was today, would you vote for Kelly Ayotte the Republican, Maggie Hassan the Democrat, or Brian Chabot the Libertarian? [IF UNDECIDED: If you had to vote for one of the following candidates at this moment, who do you lean toward – Kelly Ayotte or Maggie Hassan?] [NAMES WERE ROTATED]
| (with leaners) | Sept. 2016 |
| Kelly Ayotte | 47% |
| Maggie Hassan | 45% |
| Brian Chabot | 2% |
| (VOL) Other candidate | <1% |
| (VOL) Undecided | 5% |
| (n) | (400) |
4. If the election for governor was today, would you vote for Chris Sununu the Republican, Colin Van Ostern the Democrat, or Max Abramson the Libertarian? [IF UNDECIDED: If you had to vote for one of the following candidates at this moment, who do you lean toward – Chris Sununu or Colin Van Ostern?] [NAMES WERE ROTATED]
| (with leaners) | Sept. 2016 |
| Chris Sununu | 49% |
| Colin Van Ostern | 43% |
| Max Abramson | 1% |
| (VOL) Other candidate | <1% |
| (VOL) Undecided | 7% |
| (n) | (400) |
Regardless of who you may support for president…
[QUESTIONS 5 & 6 WERE ROTATED]
5. Is your general impression of Donald Trump favorable or unfavorable, or do you have no opinion of him?
| Sept. 2016 | |
| Favorable | 30% |
| Unfavorable | 63% |
| No opinion | 7% |
| (n) | (400) |
6. Is your general impression of Hillary Clinton favorable or unfavorable, or do you have no opinion of her?
| Sept. 2016 | |
| Favorable | 36% |
| Unfavorable | 56% |
| No opinion | 8% |
| (n) | (400) |
7. Who do you trust more to handle the economy and jobs – Donald Trump or Hillary Clinton? [NAMES WERE ROTATED]
| Sept. 2016 | |
| Trump | 42% |
| Clinton | 51% |
| (VOL) Neither | 6% |
| (VOL) Don’t know | 1% |
| (n) | (400) |
Turning to the Senate race…
[QUESTIONS 8 & 9 WERE ROTATED]
8. Is your general impression of Kelly Ayotte favorable or unfavorable, or do you have no opinion of her?
| Sept. 2016 | |
| Favorable | 48% |
| Unfavorable | 32% |
| No opinion | 20% |
| (n) | (400) |
9. Is your general impression of Maggie Hassan favorable or unfavorable, or do you have no opinion of her?
| Sept. 2016 | |
| Favorable | 47% |
| Unfavorable | 27% |
| No opinion | 26% |
| (n) | (400) |
10. Do you approve or disapprove of the job Kelly Ayotte is doing as U.S. senator?
| Sept. 2016 | |
| Approve | 50% |
| Disapprove | 38% |
| (VOL) No opinion | 12% |
| (n) | (400) |
11. Do you approve or disapprove of the job Maggie Hassan is doing as governor?
| Sept. 2016 | |
| Approve | 60% |
| Disapprove | 31% |
| (VOL) No opinion | 9% |
| (n) | (400) |
Turning to the governor’s race…
[QUESTIONS 12 & 13 WERE ROTATED]
12. Is your general impression of Chris Sununu favorable or unfavorable, or do you have no opinion of him?
| Sept. 2016 | |
| Favorable | 36% |
| Unfavorable | 22% |
| No opinion | 41% |
| (n) | (400) |
13. Is your general impression of Colin Van Ostern favorable or unfavorable, or do you have no opinion of him?
| Sept. 2016 | |
| Favorable | 28% |
| Unfavorable | 6% |
| No opinion | 66% |
| (n) | (400) |
14. Have you read or heard about Donald Trump’s recent admission that Barack Obama was definitely born in the United States, or have you not heard about this?
| Sept. 2016 | |
| Yes | 86% |
| No | 13% |
| (VOL) Don’t know | 1% |
| (n) | (400) |
15. Trump had expressed doubt about Obama’s country of birth for a number of years. Do you think Trump really believes Obama was born in the U.S. or did he just say that now for political reasons?
| Sept. 2016 | |
| Really believes | 29% |
| For political reasons | 51% |
| (VOL) Both | 1% |
| (VOL) Don’t know | 19% |
| (n) | (400) |
16. In his statement, Trump also claimed Hillary Clinton and her campaign started the Obama birther controversy during the 2008 election. Do you believe or not believe that Clinton played a part in spreading the Obama birther story?
| Sept. 2016 | |
| Believe | 29% |
| Do not believe | 52% |
| (VOL) Don’t know | 18% |
| (n) | (400) |
17. Does his recent statement on this issue make you more likely or less likely to support Trump, or does it have no impact on your vote?
| Sept. 2016 | |
| More likely | 3% |
| Less likely | 15% |
| No impact | 80% |
| (VOL) Don’t know | 2% |
| (n) | (400) |
METHODOLOGY
The Monmouth University Poll was sponsored and conducted by the Monmouth University Polling Institute from September 17 to 20, 2016 with a random sample of 400 likely New Hampshire voters. Interviews were conducted by a live caller in English, including 350 drawn from a list of registered voters (200 landline / 150 cell phone) and a random digit dial supplement of 50 cell phone interviews. Monmouth is responsible for all aspects of the survey design, data weighting and analysis. The final sample is weighted for age, gender, race and partisanship based on voter list and U.S. Census information. Data collection support provided by Braun Research (field), Aristotle (voter list sample), and SSI (RDD sample). For results based on this sample, one can say with 95% confidence that the error attributable to sampling has a maximum margin of plus or minus 4.9 percentage points (unadjusted for sample design). Sampling error can be larger for sub-groups (see table below). In addition to sampling error, one should bear in mind that question wording and practical difficulties in conducting surveys can introduce error or bias into the findings of opinion polls.
| DEMOGRAPHICS (weighted) |
| Self-Reported |
| 23% Republican |
| 51% Independent |
| 26% Democrat |
| 49% Male |
| 51% Female |
| 19% 18-34 |
| 26% 35-49 |
| 32% 50-64 |
| 24% 65+ |
| 94% White |
| 1% Black |
| 3% Hispanic |
| 2% Other |
Click on pdf file link below for full methodology and results by key demographic groups.


