
West Long Branch, NJ – Public opinion is divided on the recently passed foreign aid package. Support registers a few points higher than opposition while 1 in 5 have no opinion. The Monmouth (“Mon-muth”) University Poll finds that passage of this legislation has not had a sizable impact on opinion of House Speaker Mike Johnson’s job performance. Only 1 in 5 want to replace him. In other poll results, Americans tend to think Democrats are more successful than Republicans at passing legislation, while President Joe Biden’s job rating continues to tick up after bottoming out at the end of last year.
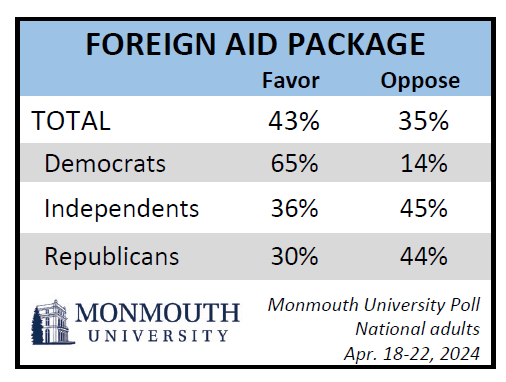
Just over 4 in 10 (43%) Americans are in favor of the recently passed bills to provide aid for Israel, Ukraine and Taiwan, while 35% are opposed. Another 21% have no opinion. Democrats broadly support the foreign aid package (65% favor and 14% oppose), while Republicans (30% favor and 44% oppose) and independents (36% favor and 45% oppose) are somewhat more likely to be against than for the deal.
“The foreign aid package may be a big policy win, but politically it’s a wash for Speaker Johnson,” said Patrick Murray, director of the independent Monmouth University Polling Institute.
Johnson also proposed a bill to deal with immigration and secure the U.S. border, which was killed on a procedural vote last weekend. Based on their first impressions of that bill, 35% of those polled are in favor of it and 23% are opposed, with 42% registering no opinion. Support for this immigration bill is slightly higher than the bipartisan Senate proposal negotiated a couple months ago – 23% were in favor and 33% opposed that deal in a February Monmouth poll. Overall, 38% say the House bill is not tough enough when it comes to dealing with illegal immigration, 22% say it is tough enough and 18% say it is too tough. When Monmouth polled opinion of the Senate bill in February, 47% said it was not tough enough on illegal immigration, 28% said it was tough enough, and 12% said it was too tough.
The driving factor in the varying reactions to these two immigration bills is partisanship. More than half (56%) of Republicans opposed the bipartisan Senate measure two months ago, but 51% support the recent Johnson led effort. Democrats were more supportive of the earlier Senate immigration deal (41% favor and 13% oppose) than they are of the recent House proposal (22% favor and 27% oppose), but this difference is not nearly as stark as the gap in Republican opinion. Interestingly, Republicans are more supportive of the Johnson proposal than the Senate one even though 61% say Johnson’s bill is not tough enough on illegal immigration. The comparable result for the bipartisan Senate deal was 77% who said it was not tough enough.
“It’s important to keep in mind that very few people know the details of this legislation. Public opinion looks more to the sponsor’s partisan pedigree to signal whether they should or should not offer their support,” said Murray.
Passing this foreign aid legislation has not had a sizable impact on Johnson’s overall job rating, at least not immediately. Currently, 21% approve and 34% disapprove of his performance as Speaker of the House, with 45% registering no opinion. In December, he had a 17% approve and 31% disapprove rating. There have been some small partisan shifts. Democrats are nominally more positive about Johnson now (12%) than they were at the end of last year (3%). Republicans, on the other hand, have become more negative – with 19% disapproval now compared with just 5% four months ago – while his approval level has not changed (36% now and 37% in December). There have been calls from a few GOP House members to oust Johnson. Overall, 20% of Americans are in favor of replacing him as Speaker and 25% are opposed. Most (55%) take no view on this issue. Republican opinion specifically stands at 20% in favor of a leadership change and 32% who are opposed.
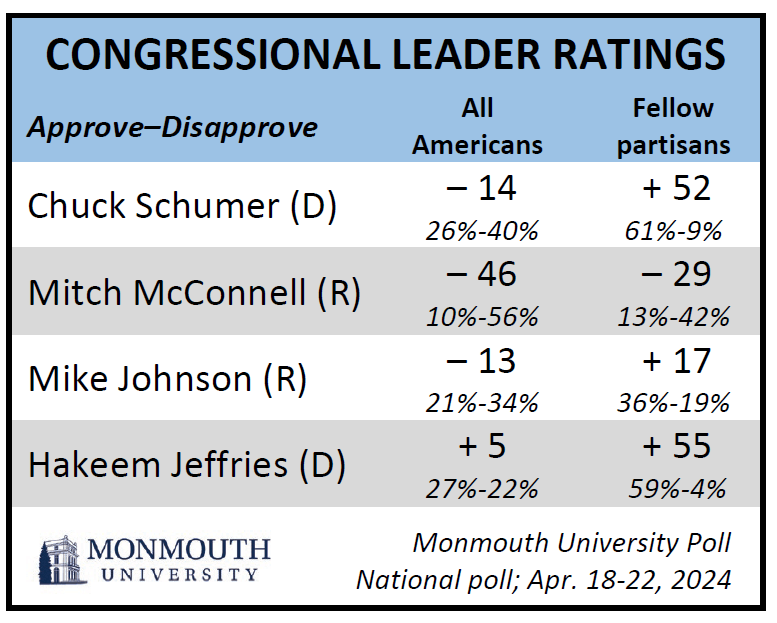
Of note, Johnson continues to garner more positive opinion from rank-and-file Republicans than does his counterpart in the U.S. Senate. In the current poll, Minority Leader Mitch McConnell continues his long streak of dismal ratings at 10% approve and 56% disapprove among all Americans and just 13% approve and 42% disapprove among his fellow Republicans. The Democratic leadership receives better ratings. Even though Senate Majority Leader Chuck Schumer has a net negative rating among all Americans (26% approve and 40% disapprove), he earns solidly positive marks among his fellow Democrats (61% approve and 9% disapprove). House Minority Leader Hakeem Jeffries is the only congressional leader to get a net positive rating among all Americans (27% approve and 22% disapprove), although 50% do not have an opinion of him. Among his fellow Democrats, Jeffries (59% approve and 4% disapprove) is about as well-known and well-liked as Schumer. Both Schumer and Jeffries have seen their Democratic approval numbers increase by more than 10 percentage points since December.
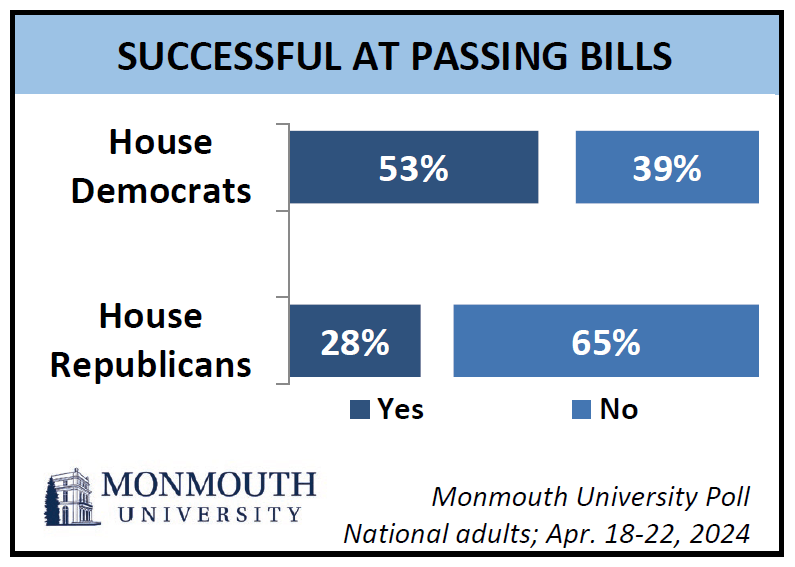
The Monmouth University Poll also asked about the public’s impressions of legislative productivity in the House of Representatives. Taking into account that they may not agree with everything each party stands for, 53% of Americans say Democrats have been generally successful at being able to get bills passed when they control the House, while 39% say they have been unsuccessful. This is a significant contrast with views of the other party’s productivity. Just 28% of Americans say House Republicans have been generally successful at passing legislation when they are in charge while 65% say they have been unsuccessful. Democrats are more likely to say their party is generally successful at getting bills passed – 73% say this about their party but only 21% say the same about the GOP. This is different from Republicans, who tend to have the same view of both parties – 41% say Republicans are generally successful and 40% say Democrats are generally successful at passing legislation when they control the House.
“We’ve gone from one of the most productive to one of the least productive Congresses over the course of Biden’s time in office. Most Americans have noticed the disparity, but this metric does not appear to have much impact on their overall opinion. Views of Congress have remained largely negative over the past three years regardless of which party controls the House,” said Murray.
Current opinion of Congress’ performance stands at 14% approve and 79% disapprove. The highest this rating reached since Republicans took control of the House last year was 23% (March 2023). Over the prior two-year term when Democrats led both legislative chambers, congressional approval generally ranged between 15% and 26%, although it did briefly top 30% toward the beginning of that term (reaching 35% in January and April 2021). Congressional approval has generally ranged between the mid-teens and the mid-20s since Monmouth started asking this question in 2013.
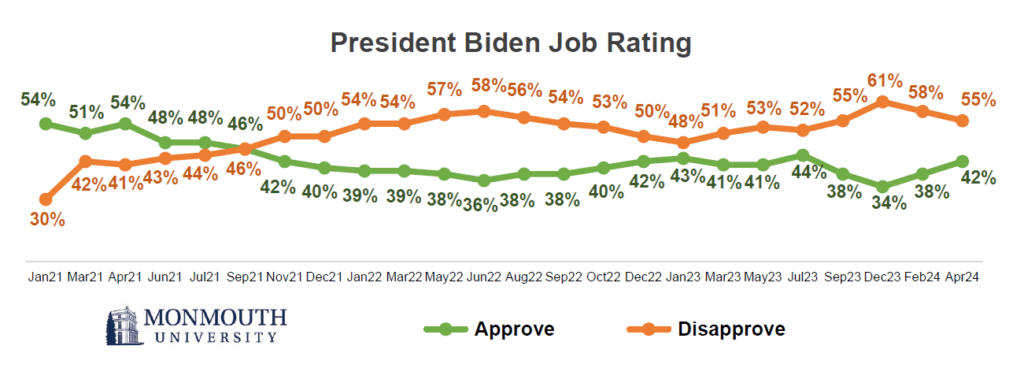
Public opinion of Biden’s job performance as president currently stands at 42% approve and 55% disapprove. This represents a continued improvement from Monmouth’s December poll which marked an all-time low for Biden since he took office (34% approve and 61% disapprove). His job rating in February was 38% approve and 58% disapprove. Biden’s job rating went from a net positive to a net negative in the fall of 2021 and continued to worsen into the summer of 2022. It slowly started to rebound through the remainder of the year, but then grew more negative during 2023. Currently, 86% of Democrats give Biden a positive job rating, which is up from 74% in December. However, just 31% of independents (24% in December) and 7% of Republicans (5% in December) approve of his job performance.
In other poll results, Vice President Kamala Harris receives a job rating of 40% approve and 55% disapprove. This is a slight improvement from her recent polling (35% approve and 58% disapprove in February). Only 17% of the public says the country is going in the right direction, while 69% say it is on the wrong track. This finding has been fairly stable over the past year and a half. Democrats are split between saying the country is heading in the right (38%) or wrong (38%) direction, while nearly all Republicans (95%) and most independents (76%) feel things have gotten off on the wrong track.
The Monmouth University Poll was conducted by telephone from April 18 to 22, 2024 with 808 adults in the United States. The question results in this release have a margin of error of +/- 4.1 percentage points for the full sample. The poll was conducted by the Monmouth University Polling Institute in West Long Branch, NJ.
QUESTIONS AND RESULTS
(* Some columns may not add to 100% due to rounding.)
1.Do you approve or disapprove of the job Joe Biden is doing as president?
| Trend: | April 2024 | Feb. 2024 | Dec. 2023 | Sept. 2023 | July 2023 | May 2023 | March 2023 | Jan. 2023 | Dec. 2022 | Oct. 2022 | Sept. 2022 | Sept. 2022 | June 2022 | May 2022 | March 2022 | Jan. 2022 |
|---|---|---|---|---|---|---|---|---|---|---|---|---|---|---|---|---|
| Approve | 42% | 38% | 34% | 38% | 44% | 41% | 41% | 43% | 42% | 40% | 38% | 38% | 36% | 38% | 39% | 39% |
| Disapprove | 55% | 58% | 61% | 55% | 52% | 53% | 51% | 48% | 50% | 53% | 54% | 56% | 58% | 57% | 54% | 54% |
| (VOL) No opinion | 3% | 5% | 5% | 7% | 4% | 6% | 8% | 9% | 8% | 7% | 8% | 7% | 6% | 5% | 7% | 7% |
| (n) | (808) | (902) | (803) | (814) | (910) | (981) | (805) | (805) | (805) | (808) | (806) | (808) | (978) | (807) | (809) | (794) |
| Trend: Continued | Dec. 2021 | Nov. 2021 | Sept. 2021 | July 2021 | June 2021 | April 2021 | March 2021 | Jan. 2021 |
|---|---|---|---|---|---|---|---|---|
| Approve | 40% | 42% | 46% | 48% | 48% | 54% | 51% | 54% |
| Disapprove | 50% | 50% | 46% | 44% | 43% | 41% | 42% | 30% |
| (VOL) No opinion | 11% | 9% | 8% | 8% | 9% | 5% | 8% | 16% |
| (n) | (808) | (811) | (802) | (804) | (810) | (800) | (802) | (809) |
2.Do you approve or disapprove of the job Kamala Harris is doing as vice president?
| Trend: | April 2024 | Feb. 2024 | Dec. 2023 | Sept. 2023 | July 2023 | May 2023 | March 2023 |
|---|---|---|---|---|---|---|---|
| Approve | 40% | 35% | 35% | 36% | 40% | 37% | 36% |
| Disapprove | 55% | 58% | 57% | 56% | 52% | 52% | 53% |
| (VOL) No opinion | 5% | 7% | 8% | 8% | 7% | 11% | 12% |
| (n) | (808) | (902) | (803) | (814) | (910) | (981) | (805) |
3.Do you approve or disapprove of the job the U.S. Congress is doing?
| Trend: | April 2024 | Feb. 2024 | Dec. 2023 | Sept. 2023 | July 2023 | May 2023 | March 2023 | Jan. 2023 |
|---|---|---|---|---|---|---|---|---|
| Approve | 14% | 14% | 17% | 17% | 22% | 18% | 23% | 19% |
| Disapprove | 79% | 79% | 77% | 74% | 68% | 72% | 68% | 67% |
| (VOL) No opinion | 7% | 7% | 6% | 9% | 10% | 9% | 10% | 14% |
| (n) | (808) | (902) | (803) | (814) | (910) | (981) | (805) | (805) |
| Trend: Continued | Dec. 2022 | Oct. 2022 | Sept. 2022 | Aug. 2022 | June 2022 | May 2022 | March 2022 | Jan. 2022 | Dec. 2021 | Nov. 2021 | Sept. 2021 | July 2021 | June 2021 | April 2021 | March 2021 | Jan. 2021 |
|---|---|---|---|---|---|---|---|---|---|---|---|---|---|---|---|---|
| Approve | 26% | 23% | 23% | 17% | 15% | 15% | 21% | 19% | 23% | 18% | 22% | 23% | 21% | 35% | 30% | 35% |
| Disapprove | 62% | 69% | 66% | 74% | 78% | 77% | 71% | 74% | 66% | 70% | 65% | 62% | 65% | 56% | 59% | 51% |
| (VOL) No opinion | 12% | 8% | 11% | 9% | 7% | 8% | 8% | 6% | 11% | 12% | 13% | 15% | 15% | 9% | 11% | 14% |
| (n) | (805) | (808) | (806) | (808) | (978) | (807) | (809) | (794) | (808) | (811) | (802) | (804) | (810) | (800) | (802) | (809) |
| Trend: Continued | Nov. 2020 | Early June 2020 | May 2020 | April 2020 | Feb. 2020 | Jan. 2020 | Dec. 2019 | Nov. 2019 | Sept. 2019 | Aug. 2019 | June 2019 | May 2019 | April 2019 | March 2019 | Jan. 2019 |
|---|---|---|---|---|---|---|---|---|---|---|---|---|---|---|---|
| Approve | 23% | 22% | 32% | 32% | 20% | 24% | 22% | 23% | 21% | 17% | 19% | 20% | 24% | 23% | 18% |
| Disapprove | 64% | 69% | 55% | 55% | 69% | 62% | 65% | 64% | 68% | 71% | 69% | 71% | 62% | 68% | 72% |
| (VOL) No opinion | 13% | 9% | 13% | 13% | 11% | 14% | 13% | 13% | 11% | 13% | 12% | 9% | 14% | 9% | 10% |
| (n) | (810) | (807) | (808) | (857) | (902) | (903) | (903) | (908) | (1,161) | (800) | (751) | (802) | (801) | (802) | (805) |
| Trend: Continued | Nov. 2018 | Aug. 2018 | June 2018 | April 2018 | March 2018 | Jan. 2018 | Dec. 2017 | Sept. 2017 | Aug. 2017 | July 2017 | May 2017 | March 2017 | Jan. 2017 |
|---|---|---|---|---|---|---|---|---|---|---|---|---|---|
| Approve | 23% | 17% | 19% | 17% | 18% | 21% | 16% | 17% | 18% | 19% | 19% | 25% | 23% |
| Disapprove | 63% | 69% | 67% | 71% | 72% | 68% | 65% | 69% | 69% | 70% | 68% | 59% | 66% |
| (VOL) No opinion | 14% | 14% | 14% | 12% | 11% | 11% | 19% | 15% | 13% | 11% | 13% | 16% | 11% |
| (n) | (802) | (805) | (806) | (803) | (803) | (806) | (806) | (1,009) | (805) | (800) | (1,002) | (801) | (801) |
| Trend: Continued | Sept. 2016* | Aug. 2016* | June 2016* | March 2016 | Jan. 2016 | Dec. 2015 | Oct. 2015 | Sept. 2015 | Aug. 2015 | July 2015 | June 2015 | April 2015 | Jan. 2015 | Dec. 2014 | July 2013 |
|---|---|---|---|---|---|---|---|---|---|---|---|---|---|---|---|
| Approve | 15% | 14% | 17% | 22% | 17% | 16% | 17% | 19% | 18% | 18% | 19% | 21% | 18% | 17% | 14% |
| Disapprove | 77% | 78% | 76% | 68% | 73% | 73% | 71% | 71% | 72% | 69% | 71% | 67% | 70% | 73% | 76% |
| (VOL) No opinion | 8% | 9% | 7% | 10% | 10% | 10% | 12% | 11% | 11% | 12% | 10% | 12% | 11% | 11% | 10% |
| (n) | (802) | (803) | (803) | (1,008) | (1,003) | (1,006) | (1,012) | (1,009) | (1,203) | (1,001) | (1,002) | (1,005) | (1,003) | (1,008) | (1,012) |
4.Would you say things in the country are going in the right direction, or have they gotten off on the wrong track?
| Trend: | April 2024 | Feb. 2024 | Dec. 2023 | Sept. 2023 | July 2023 | May 2023 | March 2023 | Jan. 2023 |
|---|---|---|---|---|---|---|---|---|
| Right direction | 17% | 17% | 20% | 17% | 25% | 16% | 22% | 24% |
| Wrong track | 69% | 69% | 69% | 68% | 68% | 74% | 72% | 73% |
| (VOL) Depends | 12% | 13% | 9% | 12% | 5% | 6% | 3% | 1% |
| (VOL) Don’t know | 2% | 1% | 2% | 2% | 3% | 4% | 3% | 2% |
| (n) | (808) | (902) | (803) | (814) | (910) | (981) | (805) | (805) |
| Trend: Continued | Dec. 2022 | Sept. 2022 | Aug. 2022 | June 2022 | May 2022 | March 2022 | Jan. 2022 | Dec. 2021 | Nov. 2021 | Sept. 2021 | July 2021 | June 2021 | April 2021 | March 2021 | Jan. 2021 |
|---|---|---|---|---|---|---|---|---|---|---|---|---|---|---|---|
| Right direction | 28% | 23% | 15% | 10% | 18% | 24% | 24% | 30% | 31% | 29% | 38% | 37% | 46% | 34% | 42% |
| Wrong track | 68% | 74% | 82% | 88% | 79% | 73% | 71% | 66% | 64% | 65% | 56% | 57% | 50% | 61% | 51% |
| (VOL) Depends | 2% | 2% | 1% | 1% | 2% | 1% | 3% | 1% | 2% | 4% | 3% | 3% | 2% | 4% | 3% |
| (VOL) Don’t know | 3% | 2% | 2% | 1% | 2% | 2% | 2% | 3% | 3% | 2% | 4% | 3% | 2% | 2% | 4% |
| (n) | (805) | (806) | (808) | (978) | (807) | (809) | (794) | (808) | (811) | (802) | (804) | (810) | (800) | (802) | (809) |
| Trend: Continued | Nov. 2020 | Early Sept. 2020 | Aug. 2020 | Late June 2020 | Early June 2020 | May 2020 | April 2020 | March 2020 | Feb. 2020 | Jan. 2020 |
|---|---|---|---|---|---|---|---|---|---|---|
| Right direction | 26% | 27% | 22% | 18% | 21% | 33% | 30% | 39% | 37% | 37% |
| Wrong track | 68% | 66% | 72% | 74% | 74% | 60% | 61% | 54% | 57% | 56% |
| (VOL) Depends | 4% | 4% | 4% | 5% | 4% | 4% | 5% | 4% | 6% | 6% |
| (VOL) Don’t know | 2% | 3% | 2% | 3% | 1% | 3% | 5% | 3% | 1% | 1% |
| (n) | (810) | (867) | (868) | (867) | (807) | (808) | (857) | (851) | (902) | (903) |
| Trend: Continued | Dec. 2019 | Nov. 2019 | Sept. 2019 | Aug. 2019 | June 2019 | May 2019 | April 2019 | March 2019 | Nov. 2018 | Aug. 2018 | June 2018 | April 2018 | March 2018 | Jan. 2018 |
|---|---|---|---|---|---|---|---|---|---|---|---|---|---|---|
| Right direction | 32% | 30% | 30% | 28% | 31% | 29% | 28% | 29% | 35% | 35% | 40% | 33% | 31% | 37% |
| Wrong track | 56% | 61% | 61% | 62% | 62% | 63% | 62% | 63% | 55% | 57% | 53% | 58% | 61% | 57% |
| (VOL) Depends | 8% | 7% | 6% | 8% | 6% | 4% | 7% | 6% | 7% | 6% | 3% | 5% | 6% | 3% |
| (VOL) Don’t know | 4% | 2% | 2% | 2% | 2% | 3% | 3% | 2% | 3% | 3% | 3% | 4% | 1% | 3% |
| (n) | (903) | (908) | (1,161) | (800) | (751) | (802) | (801) | (802) | (802) | (805) | (806) | (803) | (803) | (806) |
| Trend: Continued | Dec. 2017 | Aug. 2017 | May 2017 | March 2017 | Jan. 2017 | Aug. 2016* | Oct. 2015 | July 2015 | June 2015 | April 2015 | Dec. 2014 | July 2013 |
|---|---|---|---|---|---|---|---|---|---|---|---|---|
| Right direction | 24% | 32% | 31% | 35% | 29% | 30% | 24% | 28% | 23% | 27% | 23% | 28% |
| Wrong track | 66% | 58% | 61% | 56% | 65% | 65% | 66% | 63% | 68% | 66% | 69% | 63% |
| (VOL) Depends | 7% | 4% | 5% | 4% | 4% | 2% | 6% | 5% | 5% | 5% | 5% | 5% |
| (VOL) Don’t know | 3% | 5% | 3% | 5% | 2% | 3% | 4% | 3% | 3% | 2% | 3% | 4% |
| (n) | (806) | (805) | (1,002) | (801) | (801) | (803) | (1,012) | (1,001) | (1,002) | (1,005) | (1,008) | (1,012) |
[QUESTIONS 5-8 WERE ROTATED]
5.Do you approve or disapprove of the job Chuck Schumer is doing as Senate Majority Leader, or do you have no opinion of him?
| Trend: | April 2024 | Dec. 2023 | July 2023 | Jan. 2023 | Dec. 2022 | Nov. 2021 | April 2018* | July 2017* |
|---|---|---|---|---|---|---|---|---|
| Approve | 26% | 21% | 25% | 24% | 19% | 21% | 16% | 17% |
| Disapprove | 40% | 41% | 37% | 37% | 37% | 37% | 29% | 28% |
| No opinion | 34% | 38% | 38% | 39% | 44% | 43% | 55% | 55% |
| (n) | (808) | (803) | (910) | (805) | (805) | (811) | (803) | (800) |
6.Do you approve or disapprove of the job Mitch McConnell is doing as Senate Minority Leader, or do you have no opinion of him?
| Trend: | April 2024 | Dec. 2023 | July 2023 | Jan. 2023 | Dec. 2022 | Jan. 2020* | Nov. 2019* | Jan. 2019* | Nov. 2018* | April 2018* | July 2017* |
|---|---|---|---|---|---|---|---|---|---|---|---|
| Approve | 10% | 6% | 12% | 12% | 12% | 21% | 15% | 15% | 15% | 10% | 12% |
| Disapprove | 56% | 60% | 50% | 52% | 56% | 39% | 39% | 40% | 28% | 38% | 38% |
| No opinion | 35% | 34% | 37% | 36% | 32% | 40% | 46% | 45% | 57% | 52% | 49% |
| (n) | (808) | (803) | (910) | (805) | (805) | (903) | (908) | (805) | (802) | (803) | (800) |
7.Do you approve or disapprove of the job Mike Johnson is doing as Speaker of the House, or do you have no opinion of him?
| Trend: | April 2024 | Dec. 2023 |
|---|---|---|
| Approve | 21% | 17% |
| Disapprove | 34% | 31% |
| No opinion | 45% | 51% |
| (n) | (808) | (803) |
8.Do you approve or disapprove of the job Hakeem Jeffries is doing as House Minority Leader, or do you have no opinion of him?
| Trend: | April 2024 | Dec. 2023 | July 2023 | Jan. 2023 |
|---|---|---|---|---|
| Approve | 27% | 21% | 24% | 18% |
| Disapprove | 22% | 22% | 18% | 16% |
| No opinion | 50% | 56% | 59% | 66% |
| (n) | (808) | (803) | (910) | (805) |
Now, I’d like you to think about how the House of Representatives has been functioning over the past few years.
[QUESTIONS 9 & 10 WERE ROTATED]
9.Even if you don’t agree with everything they stand for, when Republicans have been in control of the House have they been generally successful or not successful at being able to get bills passed?
| Response: | April 2024 |
|---|---|
| Successful | 28% |
| Unsuccessful | 65% |
| (VOL) Don’t know | 6% |
| (n) | (808) |
10.Even if you don’t agree with everything they stand for, when Democrats have been in control of the House have they been generally successful or not successful at being able to get bills passed?
| Response: | April 2024 |
|---|---|
| Successful | 53% |
| Unsuccessful | 39% |
| (VOL) Don’t know | 8% |
| (n) | (808) |
11.Would you favor or oppose replacing Mike Johnson as Speaker of the House, or do you have no opinion on this?
| Response: | April 2024 |
|---|---|
| Favor | 20% |
| Oppose | 25% |
| No opinion | 55% |
| (n) | (808) |
12.Speaker Johnson has proposed a package of bills to provide aid to Israel, Ukraine, and Taiwan [added on 4/21: that passed the House this weekend]. How much have you heard about this – a lot, a little, or nothing at all?
| Response: | April 2024 |
|---|---|
| A lot | 42% |
| A little | 44% |
| Nothing at all | 14% |
| (n) | (808) |
13.Based on your first impressions, do you favor or oppose this foreign aid package, or do you have no opinion?
| Response: | April 2024 |
|---|---|
| Favor | 43% |
| Oppose | 35% |
| No opinion | 21% |
| (n) | (808) |
14.Speaker Johnson has also proposed a bill to deal with immigration and secure the U.S. border [added on 4/21: that did not pass the House this weekend]. How much have you heard about this – a lot, a little, or nothing at all?
| Comparison: | April 2024 | Feb. 2024* |
|---|---|---|
| A lot | 31% | 47% |
| A little | 40% | 38% |
| Nothing at all | 29% | 16% |
| (n) | (808) | (902) |
15.Based on your first impressions, do you favor or oppose this immigration bill, or do you have no opinion?
| Comparison: | April 2024 | Feb. 2024* |
|---|---|---|
| Favor | 35% | 23% |
| Oppose | 23% | 33% |
| No opinion | 42% | 45% |
| (n) | (808) | (902) |
16.Do you think this bill is too tough, not tough enough, or about right when it comes to dealing with illegal immigration?
| Comparison: | April 2024 | Feb. 2024* |
|---|---|---|
| Too tough | 18% | 12% |
| Not tough enough | 38% | 47% |
| About right | 22% | 28% |
| (VOL) Don’t know | 21% | 14% |
| (n) | (808) | (902) |
[Q17-37 held for future release.]
METHODOLOGY
The Monmouth University Poll was sponsored and conducted by the Monmouth University Polling Institute from April 18 to 22, 2024 with a probability-based national random sample of 808 adults age 18 and older. Interviews were conducted in English, and included 163 live landline telephone interviews, 349 live cell phone interviews, and 296 online surveys via a cell phone text invitation. Telephone numbers were selected through a mix of random digit dialing and list-based sampling. Landline respondents were selected with a modified Troldahl-Carter youngest adult household screen. Interviewing services were provided by Braun Research, with sample obtained from Dynata (RDD, n=484), Aristotle (list, n=168) and a panel of prior Monmouth poll participants (n=156). Monmouth is responsible for all aspects of the survey design, data weighting and analysis. The full sample is weighted for region, age, education, gender and race based on US Census information (ACS 2021 one-year survey). For results based on this sample, one can say with 95% confidence that the error attributable to sampling has a maximum margin of plus or minus 4.1 percentage points adjusted for sample design effects (1.41). Sampling error can be larger for sub-groups (see table below). In addition to sampling error, one should bear in mind that question wording and practical difficulties in conducting surveys can introduce error or bias into the findings of opinion polls.
Demographics (weighted)
Party (self-reported): 25% Republican, 44% Independent, 31% Democrat
Sex: 49% male, 50% female, 1% other
Age: 30% 18-34, 32% 35-54, 38% 55+
Race: 61% White, 12% Black, 17% Hispanic, 9% Asian/other
Education: 38% high school or less, 29% some college, 17% 4 year degree, 16% graduate degree
Click on pdf file link below for full methodology and crosstabs by key demographic groups.