West Long Branch, NJ – Property taxes and economic issues, such as the cost of living, are the biggest top-of-mind concerns for New Jersey residents when thinking about the state’s most important issues. According to the Monmouth (“Mon-muth”) University Poll, about half want to leave the state – although just over a quarter say they are very likely to do so – with cost of living being a key factor in that decision. The poll finds little awareness of the yet to be implemented Stay NJ senior property tax cut program. However, the results also suggest the program may lead some homeowners who want to leave the state to reconsider. In other poll findings, Monmouth’s benchmark Garden State Quality of Life Index has remained stable over the past year.
About half of Garden State residents mention some form of taxes when asked to name the most important issues facing New Jersey right now. Property taxes (39%) tops this list, as it has on almost every occasion Monmouth has asked this top-of-mind question going back to 2009. The second most frequently mentioned issue is the economy and cost of living (24%) which has not registered this high a concern since the 2009 gubernatorial election (27%). From 2012 to 2021, fewer New Jerseyans (between 10% and 19%) mentioned this as one of the state’s most pressing issues. There is little difference by political party in the number who name either property taxes or the economy as top issues in New Jersey.
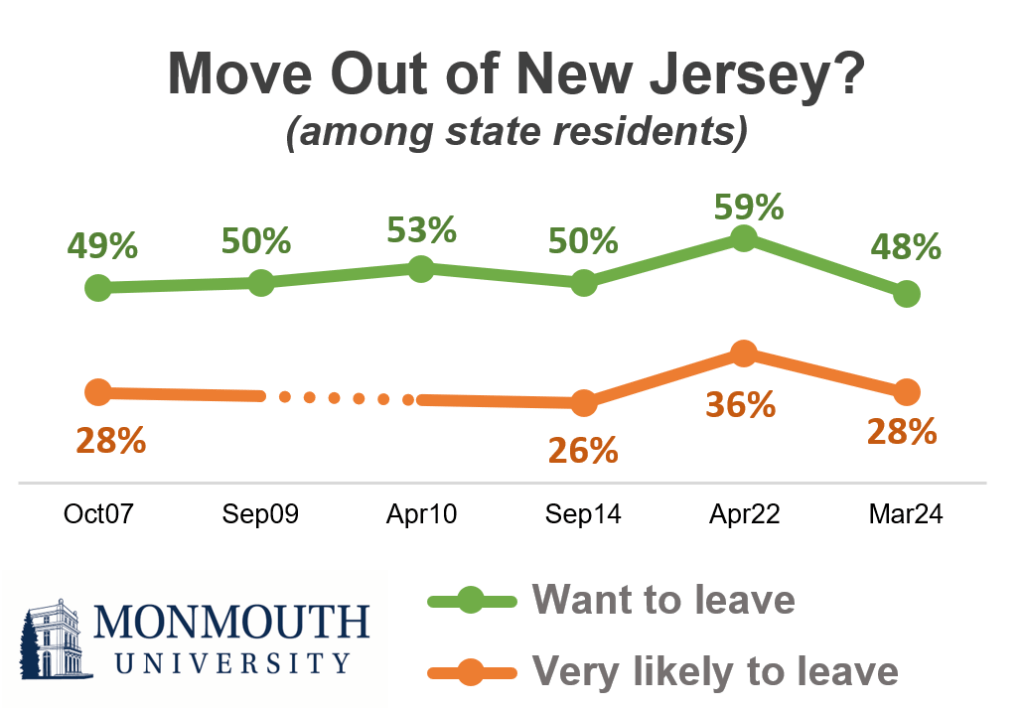
Currently, 48% of New Jerseyans say they would like to move out of the state at some point. This number is lower than in 2022 (59%), but in line with prior polling on this question between 2007 and 2014. Republicans (60%) and independents (57%) are more likely than Democrats (31%) to want to leave New Jersey. Those under the age of 55 (57% age 18-34 and 54% age 35-54) are more likely than those age 55 and older (37%) to want to leave. Those earning over $100,000 a year (55%) are more likely than lower income earners (43% earning $50,000-$100,000 and 41% earning under $50,000) to feel the same. Regardless of their desire to leave, 28% of New Jerseyans say it is very likely they will actually move out of the state at some point in their lives and another 27% say this is somewhat likely. The number saying they are very likely to leave the state is down from 2022 (36%), but similar to prior polls taken in 2007 (28%) and 2014 (26%). Those earning over $100,000 (34%) have a greater chance of being very likely to leave the state than those making between $50,000 and $100,000 (25%) or less than $50,000 (16%).
Among those who want to leave New Jersey, 43% say the state’s cost of living is the most important factor behind their desire to move out, while 52% say it is one of several top factors. Just 5% say it is not a factor at all. Among those who say they are at least somewhat likely to actually leave the state, most say the move will come after retirement (63%, a number that includes those who are already retired).
“Take New Jersey’s already high cost of living and add inflationary pressures to it. This may not be driving out more people than in the past but it certainly isn’t helping to reduce out-migration,” said Patrick Murray, director of the independent Monmouth University Polling Institute.
The state is about to implement a new program called Stay NJ that will cut property taxes in half for nearly all senior homeowners. Just 36% of New Jersey residents have heard at least a little about this, including 36% of those age 55 and older. The program will have an income cap of $500,000 per year. Monmouth asked about a cap in the poll. Just 3 in 10 New Jerseyans say the program should have a lower cap (17% at $250,000 annual income and 13% at $150,000), while 15% would cap it at $500,000 or higher. However, fully half (50%) would not cap it at all, saying the program should be available to all senior homeowners regardless of income.
The Stay NJ property tax cut program is scheduled to start in 2026. Assuming it is implemented, 27% of all New Jerseyans say they would be a lot more likely to remain in the state and 26% would be a little more likely. Another 45% say this program would have no impact on their decision whether to stay or leave. Focusing just on those New Jerseyans who say they are very likely to move out of state at some point, the Stay NJ program will make 16% of this group a lot more likely to remain and 29% a little more likely, but just over half (53%) say it would not affect their decision. These numbers shift, though, among current likely leavers who are age 55 and over – 21% of this group would be a lot more likely to stay and 40% would be a little more likely, with just 35% who say the Stay NJ program would have no impact on their decision.
“Hypotheticals in polling have to be taken with a grain of salt. However, these results suggest that the Stay NJ program will have at least some success meeting its goal of retaining a good number of senior homeowners who would otherwise leave the state. It’s worth noting that it will also have an impact on homeowners at the lower end of the income scale who don’t plan to leave because it is simply not an option for them,” said Murray.
In other poll findings, Monmouth’s exclusive Garden State Quality of Life Index score currently stands at +24, which is similar to ratings from 2023 (+23 in August and +24 in January), but slightly lower than the +27 result in April 2022. The current reading is near the midpoint of scores since Monmouth first started tracking the quality of life index in 2010. The index number jumped to +37 at the beginning of the Covid pandemic in April 2020, but dropped back to +25 in May 2021. In prior years, the index rating ranged between +18 and +31, with an outlying low point of +13 registered in February 2019.
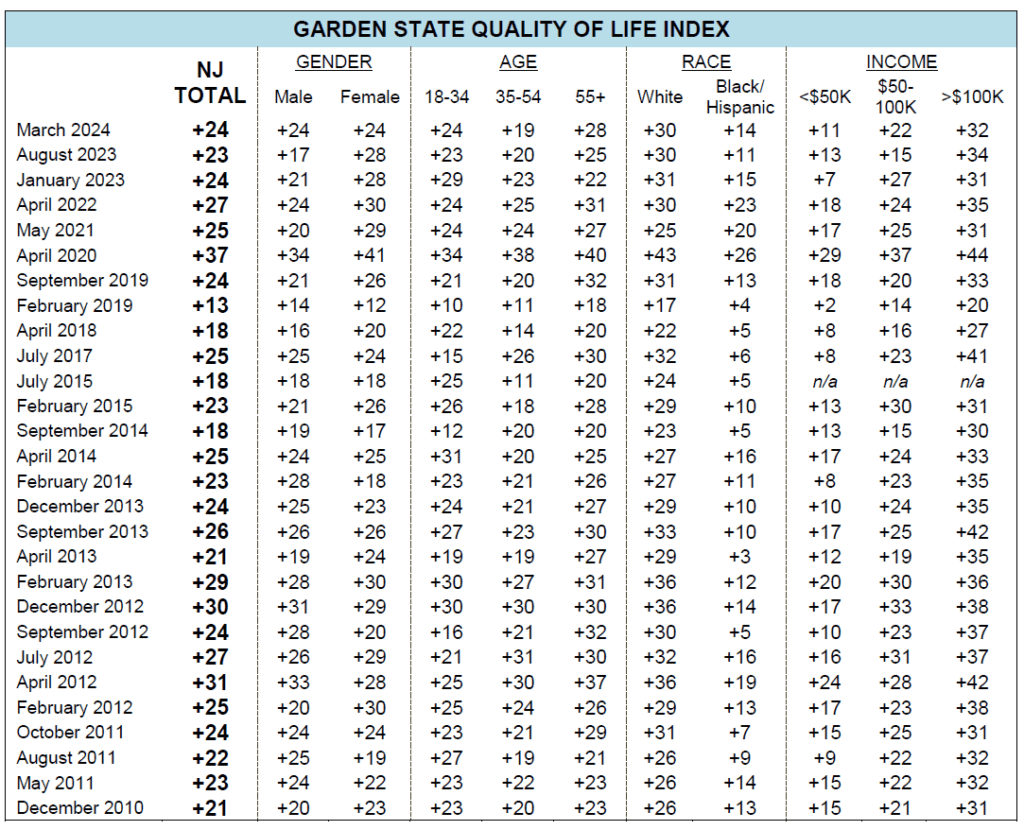
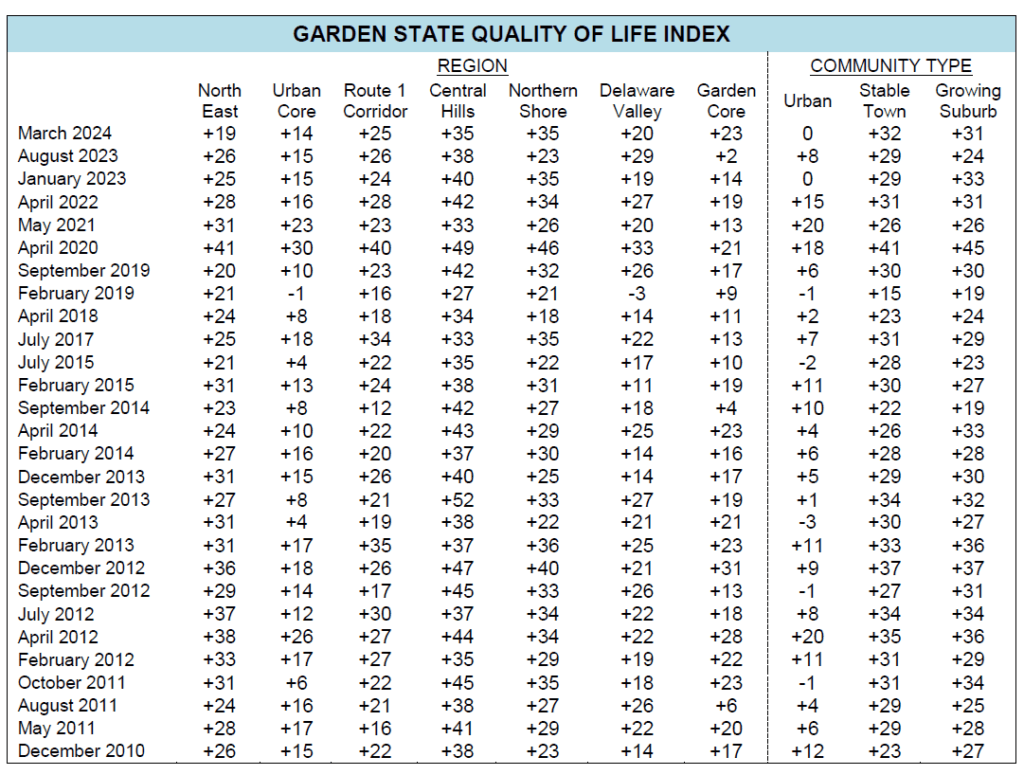
The index experienced some off-setting partisan shifts last summer that have returned to earlier levels. Specifically, Democrats (+40) remain most optimistic about New Jersey’s quality of life when compared with independents (+16) and Republicans (+14). Regionally, the Central Hills (+35) and the Northern Shore (+35) register the highest index ratings while the Urban Core region (+14) is the lowest. The other regions – Route 1 (+25), Garden Core (+23), Delaware Valley (+20) and Northeast (+19) – fall in between these scores.
The Garden State Quality of Life Index was created by the Monmouth University Polling Institute in 2010 to serve as a resident-based indicator of the quality of life offered by the state of New Jersey. The index is based on five separate poll questions: overall opinion of the state as a place to live – which contributes half the index score – and ratings of one’s hometown, the performance of local schools, the quality of the local environment, and feelings of safety in one’s own neighborhood. The index can potentially range from –100 to +100.
Examining individual components of the index finds that more than 6 in 10 New Jerseyans say the state is either an excellent (18%) or good (44%) place to live, while 26% say it is only fair and 11% rate the state as poor. The current positive rating of 62% is similar to recent poll results (62% in August 2023, 63% in January 2023 and 64% in April 2022). The all-time high mark for this rating was 84% positive in February 1987. The record low was 50% in February 2019, but it improved to 61% by September of that year.
Turning to more local indicators, 75% of residents currently rate their own town or city as an excellent or good place to live. This is up from 70% in August, but similar to prior readings (between 73% and 77% from May 2021 to January 2023). New Jerseyans’ ratings for environmental quality in their local area – currently at 75% positive – have been stable since 2021. Local schools earn a 62% positive rating, which is up from 56% in August but within the 60% to 64% range recorded from May 2021 to January 2023. The percentage of state residents who currently feel very safe in their own neighborhoods at night stands at 58%. This is identical to the 58% rating in August, but is lower than prior readings from 2021 through the beginning of 2023 when it ranged between 64% and 67%.
Another poll finding that is worth mentioning is an emerging issue in Monmouth’s top-of-mind issue question. The third most frequently mentioned issue on the list of state residents’ most important issues, after property taxes and the economy, is illegal immigration (mentioned by 17%). In past polling, this issue has generally hovered only in the low single digits as a state-based concern, with prior high marks of 7% in 2018 and 2019. Unlike taxes and cost of living, the present level of concern with illegal immigration is largely partisan. One-third (33%) of Republicans name it as one of the most important issues facing New Jersey right now, while just 15% of independents and 8% of Democrats mention it as one of their top-of-mind concerns.
“It’s not clear from the poll whether those who are worried about illegal immigration can point to a specific impact on the state over the past year or two. The rise of illegal immigration as a specifically New Jersey issue seems to reflect just how much national political conflicts are influencing what we see as local concerns right now,” said Murray.
The Monmouth University Poll was conducted by telephone from February 29 to March 4, 2024 with 801 New Jersey adults. The question results in this release have a margin of error of +/- 4.2 percentage points for the full sample. The poll was conducted by the Monmouth University Polling Institute in West Long Branch, NJ.
QUESTIONS AND RESULTS
(* Some columns may not add to 100% due to rounding.)
1.Overall, how would you rate New Jersey as a placetolive – excellent, good, only fair, or poor?
| Trend*: | Excellent/ Good | Excellent | Good | Only Fair | Poor | (VOL) Don’t know | (n) |
|---|---|---|---|---|---|---|---|
| March 2024 | 62% | 18% | 44% | 26% | 11% | 1% | (801) |
| August 2023 | 62% | 20% | 42% | 25% | 12% | 0% | (814) |
| January 2023 | 63% | 18% | 45% | 25% | 12% | 0% | (809) |
| April 2022 | 64% | 19% | 45% | 22% | 13% | 1% | (802) |
| May 2021 | 59% | 16% | 43% | 27% | 14% | 0% | (706) |
| April 2020 | 68% | 24% | 44% | 23% | 7% | 1% | (704) |
| September 2019 | 61% | 15% | 46% | 26% | 12% | 1% | (713) |
| February 2019 | 50% | 11% | 39% | 32% | 17% | 1% | (604) |
| April 2018 | 54% | 15% | 39% | 29% | 17% | 1% | (703) |
| July 2017 | 59% | 15% | 44% | 28% | 13% | 0% | (800) |
| May 2016 | 62% | 16% | 46% | 28% | 10% | 0% | (806) |
| July 2015 | 55% | 12% | 43% | 30% | 15% | 0% | (503) |
| May 2015 | 63% | 13% | 50% | 27% | 10% | 1% | (500) |
| February 2015 | 63% | 15% | 48% | 25% | 11% | 1% | (805) |
| September 2014 | 61% | 13% | 48% | 25% | 13% | 1% | (802) |
| June 2014 | 62% | 15% | 47% | 26% | 11% | 0% | (800) |
| April 2014 | 64% | 15% | 49% | 26% | 10% | 0% | (803) |
| February 2014 | 63% | 15% | 48% | 26% | 11% | 0% | (803) |
| December 2013 | 65% | 20% | 45% | 26% | 9% | 0% | (802) |
| September 2013 | 65% | 19% | 46% | 25% | 10% | 1% | (783) |
| April 2013 | 61% | 15% | 46% | 27% | 11% | 0% | (806) |
| February 2013 | 68% | 18% | 50% | 24% | 7% | 1% | (803) |
| December 2012 | 72% | 20% | 52% | 21% | 5% | 1% | (816) |
| September 2012 | 65% | 15% | 50% | 23% | 11% | 0% | (805) |
| July 2012 | 69% | 17% | 52% | 23% | 8% | 0% | (803) |
| April 2012 | 70% | 20% | 50% | 23% | 7% | 0% | (804) |
| February 2012 | 62% | 15% | 47% | 26% | 11% | 1% | (803) |
| October 2011 | 67% | 15% | 52% | 24% | 8% | 0% | (817) |
| August 2011 | 57% | 14% | 43% | 31% | 11% | 1% | (802) |
| May 2011 | 59% | 14% | 45% | 29% | 11% | 0% | (807) |
| December 2010 | 63% | 17% | 46% | 26% | 10% | 1% | (2864) |
| October 2007 | 63% | 17% | 46% | 25% | 12% | 1% | (1001) |
| August 2004 | 68% | 22% | 46% | 21% | 10% | 1% | (800) |
| May 2003 | 72% | 20% | 52% | 23% | 5% | 0% | (1002) |
| April 2001 | 76% | 23% | 53% | 19% | 4% | 1% | (802) |
| March 2000 | 76% | 25% | 51% | 17% | 6% | 0% | (800) |
| May 1999 | 76% | 22% | 54% | 19% | 5% | 0% | (800) |
| February 1994 | 71% | 18% | 53% | 22% | 7% | 0% | (801) |
| March 1990 | 68% | 21% | 47% | 25% | 6% | 1% | (800) |
| February 1988 | 78% | 27% | 51% | 17% | 4% | 1% | (800) |
| February 1987 | 84% | 31% | 53% | 11% | 4% | 0% | (800) |
| May 1985 | 81% | 29% | 52% | 14% | 3% | 1% | (500) |
| October 1984 | 80% | 29% | 51% | 15% | 4% | 1% | (1000) |
| January 1981 | 66% | 16% | 50% | 26% | 7% | 1% | (1003) |
| July 1980 | 68% | 18% | 50% | 23% | 7% | 2% | (1005) |
[Q2-13 previously released.]
14.In your opinion, what are the most important one or two issues facing the state of New Jersey right now? [LIST WAS NOT READ. IF “TAXES” MENTIONED, INTERVIEWER ASKED FOR SPECIFIC TYPE.] [Note: Results add to more than 100% because multiple responses were accepted.]
| Trend: | March 2024 | Aug. 2021* | Feb. 2019 | April 2018 | July 2017 | Dec. 2013 | Dec. 2012 | Feb. 2012 | July 2009** |
|---|---|---|---|---|---|---|---|---|---|
| Property taxes | 39% | 32% | 45% | 45% | 48% | 25% | 31% | 42% | 45% |
| Income tax | 7% | 9% | 9% | 9% | 8% | 7% | 6% | 8% | 7% |
| Sales tax | 5% | 7% | 6% | 8% | 7% | 2% | 3% | 4% | 4% |
| Other tax, general taxes | 9% | 4% | 8% | 8% | 5% | 12% | 6% | 3% | 5% |
| Jobs | 2% | 7% | 11% | 14% | 14% | 35% | 30% | 42% | 18% |
| Economy, cost of living | 24% | 15% | 16% | 14% | 10% | 10% | 19% | 19% | 27% |
| State budget, govt. spending | 3% | 7% | 6% | 7% | 8% | 4% | 5% | 8% | 18% |
| Education, public schools | 10% | 10% | 9% | 16% | 14% | 21% | 10% | 20% | 12% |
| Higher education | 1% | 1% | 1% | 3% | 3% | 3% | 2% | 3% | n/a |
| Transportation, infrastructure | 9% | 7% | 10% | 14% | 10% | 2% | 3% | 2% | 1% |
| Environment | 4% | 3% | 4% | 4% | 4% | 2% | 2% | 1% | 2% |
| Health insurance, care | 4% | 6% | 9% | 6% | 10% | 11% | 8% | 5% | 18% |
| Crime, guns, drugs | 10% | 6% | 8% | 12% | 9% | 6% | 4% | 5% | 2% |
| Public pensions & benefits | 1% | 1% | 1% | 3% | 5% | 2% | 2% | 2% | n/a |
| Housing | 7% | 4% | 6% | 5% | 6% | 3% | 2% | 1% | n/a |
| Illegal immigration | 17% | 4% | 7% | 7% | 3% | 1% | 1% | 1% | 2% |
| Auto insurance | 1% | 0% | 0% | 1% | 3% | 0% | 1% | 1% | n/a |
| Marijuana legalization | 1% | 1% | 7% | 5% | 2% | n/a | n/a | n/a | n/a |
| Opioid crisis, drug addiction | 0% | 0% | 2% | 4% | 2% | n/a | n/a | n/a | n/a |
| Race, equity, police reform | 1% | 2% | n/a | n/a | n/a | n/a | n/a | n/a | n/a |
| Abortion, reproductive rights | 3% | n/a | n/a | n/a | n/a | n/a | n/a | n/a | n/a |
| Other | 10% | 46%+ | 9% | 8% | 12% | 17%+ | 27%+ | 8% | 11% |
| Nothing/no answer | 10% | 7% | 4% | 4% | 3% | 4% | 4% | 4% | 3% |
| (n) | (801) | (810) | (604) | (703) | (800) | (802) | (816) | (803) | (792) |
**July 2009 question for registered voters only: was “In your opinion, what are the most important one or two issues that the candidates for governor should talk about?”
+ “Other” includes Superstorm Sandy recovery in 2012 (23%) and 2013 (8%), and the Covid pandemic in 2021 (41%).
[Q15-23 previously released.]
24.How would you rate your town or city as a placetolive –excellent, good, only fair, or poor?
| Trend*: | Excellent/ Good | Excellent | Good | Only Fair | Poor | (VOL) Don’t know | (n) |
|---|---|---|---|---|---|---|---|
| March 2024 | 75% | 33% | 42% | 17% | 7% | 0% | (801) |
| August 2023 | 70% | 28% | 42% | 22% | 7% | 0% | (814) |
| January 2023 | 77% | 34% | 43% | 18% | 5% | 0% | (809) |
| April 2022 | 73% | 32% | 41% | 20% | 7% | 0% | (802) |
| May 2021 | 76% | 33% | 43% | 19% | 5% | 0% | (706) |
| April 2020 | 79% | 39% | 40% | 16% | 5% | 0% | (704) |
| September 2019 | 72% | 32% | 40% | 20% | 7% | 0% | (713) |
| February 2019 | 67% | 30% | 37% | 21% | 11% | 0% | (604) |
| April 2018 | 71% | 30% | 41% | 20% | 9% | 0% | (703) |
| July 2017 | 77% | 37% | 40% | 16% | 7% | 0% | (800) |
| July 2015 | 71% | 29% | 42% | 19% | 10% | 0% | (503) |
| February 2015 | 72% | 29% | 43% | 21% | 7% | 0% | (805) |
| September 2014 | 69% | 24% | 45% | 22% | 10% | 0% | (802) |
| April 2014 | 71% | 27% | 44% | 20% | 9% | 0% | (803) |
| February 2014 | 70% | 31% | 39% | 23% | 7% | 0% | (803) |
| December 2013 | 70% | 29% | 41% | 21% | 8% | 1% | (802) |
| September 2013 | 72% | 32% | 40% | 18% | 9% | 1% | (783) |
| April 2013 | 67% | 29% | 38% | 25% | 8% | 0% | (806) |
| February 2013 | 73% | 30% | 43% | 20% | 7% | 0% | (803) |
| December 2012 | 74% | 32% | 42% | 17% | 9% | 0% | (816) |
| September 2012 | 72% | 33% | 39% | 19% | 9% | 0% | (805) |
| July 2012 | 74% | 32% | 42% | 18% | 7% | 1% | (803) |
| April 2012 | 76% | 34% | 42% | 17% | 7% | 0% | (804) |
| February 2012 | 74% | 33% | 41% | 21% | 5% | 0% | (803) |
| October 2011 | 73% | 26% | 47% | 20% | 8% | 0% | (817) |
| May 2011 | 73% | 33% | 40% | 20% | 7% | 0% | (807) |
| December 2010 | 73% | 27% | 46% | 20% | 8% | 0% | (2864) |
| May 2003 | 74% | 29% | 45% | 19% | 7% | 0% | (1002) |
| April 2001 | 73% | 28% | 45% | 21% | 6% | 0% | (802) |
| May 1995 | 70% | 30% | 40% | 21% | 8% | 0% | (802) |
| June 1994 | 72% | 31% | 41% | 19% | 9% | 0% | (801) |
| September 1988 | 72% | 26% | 46% | 18% | 9% | 1% | (500) |
| October 1984 | 71% | 30% | 41% | 21% | 7% | 1% | (999) |
| June 1980 | 67% | 23% | 44% | 24% | 9% | 0% | (1005) |
| May 1977 | 66% | 25% | 41% | 24% | 10% | 0% | (1005) |
[QUESTIONS 25-27 WERE ROTATED]
25.How would you rate the quality of the environment in the area where you live – excellent, good, only fair, or poor?
| Trend*: | Excellent/ Good | Excellent | Good | Only Fair | Poor | (VOL) Don’t know | (n) |
|---|---|---|---|---|---|---|---|
| March 2024 | 75% | 30% | 45% | 18% | 7% | 0% | (801) |
| August 2023 | 75% | 28% | 47% | 19% | 5% | 1% | (814) |
| January 2023 | 78% | 30% | 48% | 17% | 5% | 1% | (809) |
| April 2022 | 76% | 31% | 45% | 17% | 7% | 0% | (802) |
| May 2021 | 76% | 32% | 44% | 18% | 6% | 0% | (706) |
| April 2020 | 81% | 36% | 45% | 15% | 4% | 0% | (704) |
| September 2019 | 72% | 31% | 41% | 22% | 6% | 1% | (713) |
| February 2019 | 71% | 27% | 44% | 21% | 8% | 0% | (604) |
| April 2018 | 73% | 29% | 44% | 20% | 6% | 1% | (703) |
| July 2017 | 76% | 37% | 39% | 14% | 8% | 1% | (800) |
| July 2015 | 71% | 27% | 44% | 20% | 9% | 0% | (503) |
| February 2015 | 72% | 27% | 45% | 23% | 4% | 0% | (805) |
| September 2014 | 72% | 24% | 48% | 21% | 5% | 1% | (802) |
| April 2014 | 76% | 27% | 49% | 18% | 6% | 0% | (803) |
| February 2014 | 73% | 29% | 44% | 21% | 6% | 0% | (803) |
| December 2013 | 69% | 27% | 42% | 24% | 7% | 0% | (802) |
| September 2013 | 75% | 30% | 45% | 18% | 7% | 1% | (783) |
| April 2013 | 70% | 27% | 43% | 22% | 7% | 0% | (806) |
| February 2013 | 71% | 26% | 45% | 24% | 4% | 2% | (803) |
| December 2012 | 73% | 25% | 48% | 20% | 7% | 1% | (816) |
| September 2012 | 72% | 30% | 42% | 20% | 7% | 0% | (805) |
| July 2012 | 74% | 30% | 44% | 19% | 7% | 1% | (803) |
| April 2012 | 75% | 30% | 45% | 18% | 6% | 1% | (804) |
| February 2012 | 77% | 29% | 48% | 17% | 5% | 0% | (803) |
| October 2011 | 72% | 25% | 47% | 19% | 9% | 0% | (817) |
| August 2011 | 79% | 31% | 48% | 16% | 5% | 0% | (802) |
| May 2011 | 79% | 33% | 46% | 15% | 6% | 0% | (807) |
| December 2010 | 66% | 14% | 52% | 25% | 9% | 0% | (2864) |
| April 2001 | 70% | 27% | 43% | 22% | 7% | 1% | (402) |
| September 1988 | 53% | 10% | 43% | 31% | 15% | 1% | (500) |
26.How would you rate the job your local schools are doing – excellent, good, only fair, or poor?
| Trend*: | Excellent/ Good | Excellent | Good | Only Fair | Poor | (VOL) Don’t know | (n) |
|---|---|---|---|---|---|---|---|
| March 2024 | 62% | 19% | 43% | 21% | 12% | 5% | (801) |
| August 2023 | 56% | 22% | 34% | 23% | 15% | 6% | (814) |
| January 2023 | 60% | 19% | 41% | 22% | 11% | 6% | (809) |
| April 2022 | 63% | 24% | 39% | 16% | 11% | 10% | (802) |
| May 2021 | 64% | 24% | 40% | 18% | 8% | 10% | (706) |
| April 2020 | 73% | 33% | 40% | 16% | 4% | 7% | (704) |
| September 2019 | 60% | 26% | 34% | 23% | 9% | 9% | (713) |
| February 2019 | 59% | 19% | 40% | 22% | 10% | 9% | (604) |
| April 2018 | 60% | 24% | 36% | 23% | 10% | 7% | (703) |
| July 2017 | 65% | 26% | 39% | 20% | 10% | 6% | (800) |
| July 2015 | 60% | 27% | 33% | 22% | 9% | 8% | (503) |
| February 2015 | 61% | 21% | 40% | 24% | 8% | 7% | (805) |
| September 2014 | 60% | 21% | 39% | 24% | 9% | 7% | (802) |
| April 2014 | 63% | 24% | 39% | 22% | 9% | 6% | (803) |
| February 2014 | 61% | 22% | 39% | 22% | 10% | 7% | (803) |
| December 2013 | 60% | 20% | 40% | 23% | 12% | 5% | (802) |
| September 2013 | 62% | 24% | 38% | 21% | 7% | 9% | (783) |
| April 2013 | 59% | 21% | 38% | 27% | 9% | 5% | (806) |
| February 2013 | 64% | 24% | 40% | 20% | 7% | 9% | (803) |
| December 2012 | 61% | 21% | 40% | 23% | 7% | 9% | (816) |
| September 2012 | 61% | 27% | 34% | 21% | 10% | 8% | (805) |
| July 2012 | 61% | 22% | 39% | 20% | 11% | 8% | (803) |
| April 2012 | 63% | 23% | 40% | 21% | 7% | 8% | (804) |
| February 2012 | 68% | 26% | 42% | 16% | 8% | 8% | (803) |
| October 2011 | 60% | 21% | 39% | 20% | 13% | 7% | (817) |
| August 2011 | 63% | 19% | 44% | 26% | 6% | 5% | (802) |
| May 2011 | 63% | 24% | 39% | 22% | 10% | 6% | (807) |
| December 2010 | 64% | 24% | 40% | 23% | 8% | 5% | (2864) |
| August 2004 | 61% | 24% | 37% | 17% | 12% | 9% | (800) |
| April 2001 | 64% | 21% | 43% | 21% | 6% | 9% | (802) |
| September 1999 | 62% | 18% | 44% | 21% | 9% | 8% | (802) |
| September 1998 | 62% | 20% | 42% | 23% | 9% | 7% | (804) |
| February 1996 | 60% | 20% | 40% | 20% | 11% | 9% | (804) |
| September 1993 | 52% | 16% | 36% | 29% | 14% | 5% | (801) |
| January 1992 | 53% | 15% | 38% | 26% | 15% | 5% | (800) |
| October 1987 | 60% | 14% | 46% | 23% | 6% | 11% | (500) |
| October 1986 | 55% | 15% | 40% | 26% | 10% | 9% | (800) |
| October 1983 | 59% | 16% | 43% | 23% | 10% | 8% | (802) |
| May 1978 | 52% | 12% | 40% | 25% | 12% | 11% | (1003) |
27.How safe do you feel in your neighborhood at night – very safe, somewhat safe, or not at all safe?
| Trend*: | Very safe | Somewhat safe | Not at all safe | (VOL) Don’t know | (n) |
|---|---|---|---|---|---|
| March 2024 | 58% | 36% | 5% | 0% | (801) |
| August 2023 | 58% | 36% | 5% | 0% | (814) |
| January 2023 | 64% | 32% | 4% | 1% | (809) |
| April 2022 | 65% | 29% | 5% | 0% | (802) |
| May 2021 | 67% | 31% | 2% | 0% | (706) |
| April 2020 | 74% | 22% | 3% | 1% | (704) |
| September 2019 | 68% | 27% | 5% | 0% | (713) |
| February 2019 | 64% | 29% | 7% | 0% | (604) |
| April 2018 | 65% | 29% | 5% | 0% | (703) |
| July 2017 | 71% | 22% | 6% | 0% | (800) |
| July 2015 | 67% | 27% | 6% | 0% | (503) |
| February 2015 | 62% | 33% | 4% | 0% | (805) |
| September 2014 | 58% | 36% | 6% | 0% | (802) |
| April 2014 | 66% | 30% | 4% | 1% | (803) |
| February 2014 | 67% | 28% | 6% | 0% | (803) |
| December 2013 | 60% | 33% | 7% | 0% | (802) |
| September 2013 | 65% | 27% | 7% | 1% | (783) |
| April 2013 | 66% | 28% | 6% | 0% | (806) |
| February 2013 | 63% | 30% | 6% | 1% | (803) |
| December 2012 | 64% | 29% | 6% | 1% | (816) |
| September 2012 | 65% | 25% | 6% | 0% | (805) |
| July 2012 | 60% | 32% | 7% | 1% | (803) |
| April 2012 | 64% | 31% | 5% | 1% | (804) |
| February 2012 | 62% | 32% | 5% | 0% | (803) |
| October 2011 | 62% | 31% | 7% | 0% | (817) |
| August 2011 | 63% | 31% | 6% | 0% | (802) |
| May 2011 | 68% | 27% | 5% | 0% | (807) |
| December 2010 | 59% | 35% | 6% | 0% | (2864) |
| February 1993 | 42% | 44% | 13% | 0% | (801) |
| October 1987 | 51% | 36% | 11% | 2% | (499) |
| October 1984 | 53% | 36% | 9% | 2% | (500) |
| May 1981 | 43% | 43% | 13% | 1% | (497) |
28.As things stand now, would you like to move out of New Jersey at some point or would you like to stay here for the rest of your life?
| Trend: | March 2024 | April 2022 | Sept. 2014 | April 2010 | Sept. 2009 | Oct. 2007 |
|---|---|---|---|---|---|---|
| Move out of New Jersey | 48% | 59% | 50% | 53% | 50% | 49% |
| Stay in New Jersey | 48% | 38% | 45% | 43% | 43% | 44% |
| (VOL) Don’t know | 3% | 3% | 5% | 4% | 7% | 7% |
| (n) | (801) | (802) | (802) | (804) | (900) | (801) |
[Question 29 was asked of those who want to move out of New Jersey: n=398, moe=+/-6.0%.]
29.How much of a factor is New Jersey’s cost of living in your desire to move out of the state – is it the most important factor, one of several top factors, or not one of the top factors?
| Response: | March 2024 |
|---|---|
| Most important factor | 43% |
| One of several top factors | 52% |
| Not one of the top factors | 5% |
| (n) | (398) |
30.Regardless of whether you want to leave New Jersey, how likely is it that you will actually move out of the state at some point in your life – very, somewhat, not too, or not all likely?
| Trend: | March 2024 | April 2022 | Sept. 2014 | Oct. 2007 |
|---|---|---|---|---|
| Very likely | 28% | 36% | 26% | 28% |
| Somewhat likely | 27% | 30% | 32% | 32% |
| Not too likely | 18% | 17% | 17% | 16% |
| Not all likely | 26% | 17% | 23% | 23% |
| (VOL) Don’t know | 1% | 1% | 2% | 1% |
| (n) | (801) | (802) | (802) | (801) |
[Question 31 was asked of those who are likely to move out of New Jersey: n=461, moe=+/-5.6%.]
31.When will you probably move – before you retire or after you retire, or are you already retired?
| Trend: | March 2024 | Sept. 2014 |
|---|---|---|
| Before retire | 36% | 50% |
| After retire | 40% | 40% |
| Already retired | 23% | 7%* |
| (VOL) Don’t know | 1% | 4% |
| (n) | (461) | (426) |
32.How concerned are you about not having enough money for retirement – very concerned, somewhat concerned, or not at all concerned?
| Trend: | March 2024 | Sept. 2014 | April 2008 |
|---|---|---|---|
| Very concerned | 40% | 34% | 42% |
| Somewhat concerned | 33% | 36% | 33% |
| Not at all concerned | 27% | 28% | 23% |
| (VOL) Don’t know | 0% | 2% | 1% |
| (n) | (801) | (802) | (803) |
33.The state has proposed a new program called Stay N.J. that will cut property taxes in half for nearly all senior citizen homeowners. How much have you heard about this program – a lot, a little, or nothing at all?
| Response: | March 2024 |
|---|---|
| A lot | 7% |
| A little | 29% |
| Nothing at all | 64% |
| (VOL) Don’t know | 0% |
| (n) | (801) |
34.If this program is implemented, will you be a lot more likely to stay in New Jersey, a little more likely, or will it have no impact on your decision whether to stay or move out of the state?
| Response: | March 2024 |
|---|---|
| A lot more likely | 27% |
| A little more likely | 26% |
| No impact | 45% |
| (VOL) Don’t know | 3% |
| (n) | (801) |
35.Should this program be available to all senior homeowners regardless of income, or should there be an income cap? [If INCOME CAP]: Should the income cap for this credit be $150,000, $250,000, $500,000, or $750,000?
| Response: | March 2024 |
|---|---|
| $150,000 cap | 13% |
| $250,000 cap | 17% |
| $500,000 cap | 11% |
| $750,000 cap | 4% |
| All senior homeowners | 50% |
| (VOL) Don’t know | 5% |
| (n) | (801) |
[Q36-42 held for future release.]
* Note: All trend results prior to 2005 come from Rutgers University’s Eagleton Poll.
METHODOLOGY
The Monmouth University Poll was sponsored and conducted by the Monmouth University Polling Institute from February 29 to March 4, 2024 with a probability-based random sample of 801 New Jersey adults age 18 and older. Interviews were conducted in English, and included 259 live landline telephone interviews, 375 live cell phone interviews, and 167 online surveys via a cell phone text invitation. Telephone numbers were selected through a mix of random digit dialing and list-based sampling. Landline respondents were selected with a modified Troldahl-Carter youngest adult household screen. Interviewing services were provided by Braun Research, with sample obtained from Dynata (RDD, n= 657) and Aristotle (list, n= 144). Monmouth is responsible for all aspects of the survey design, data weighting and analysis. The full sample is weighted for region, age, education, gender and race based on US Census information (ACS 2021 one-year survey. For results based on this sample, one can say with 95% confidence that the error attributable to sampling has a maximum margin of plus or minus 4.2 percentage points adjusted for sample design effects (1.49). Sampling error can be larger for sub-groups (see table below). In addition to sampling error, one should bear in mind that question wording and practical difficulties in conducting surveys can introduce error or bias into the findings of opinion polls.
Standard Region (by county):
North – Bergen, Essex, Hudson, Morris, Passaic, Sussex, Union, Warren
Central – Hunterdon, Mercer, Middlesex, Monmouth, Somerset
South – Atlantic, Burlington, Camden, Cape May, Cumberland, Gloucester, Ocean, Salem
Expanded Region (by county): Northeast (Bergen, Passaic), Urban Core (Essex, Hudson), Route 1 Corridor (Mercer, Middlesex, Union), Central Hills (Hunterdon, Morris, Somerset), Northern Shore (Monmouth, Ocean), Delaware Valley (Burlington, Camden, Gloucester), Garden Core (Atlantic, Cape May, Cumberland, Salem, Sussex, Warren).
Demographics (weighted)
Party (self-reported): 26% Republican, 37% Independent, 37% Democrat
Sex: 49% male, 51% female, 1% other
Age: 28% 18-34, 33% 35-54, 39% 55+
Race: 55% White, 13% Black, 19% Hispanic, 13% Asian/other
Education: 34% high school or less, 25% some college, 23% 4 year degree, 18% graduate degree
Click on pdf file link below for full methodology and crosstabs by key demographic groups.