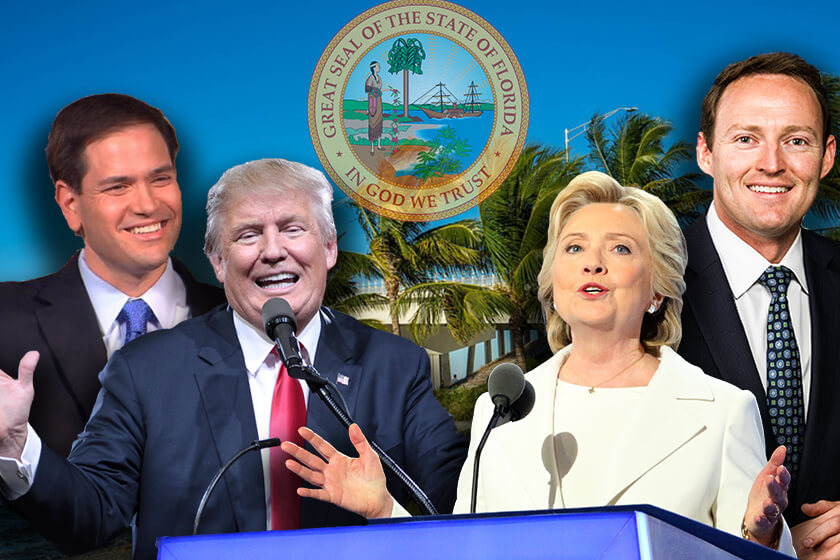
West Long Branch, NJ – Hillary Clinton holds a 5 point lead over Donald Trump in the crucial swing state of Florida. This is slightly less than the 9 point lead she held in a Monmouth University Poll of Sunshine State voters taken last month. Sen. Marco Rubio is currently locked in a tight race with his Democratic challenger Patrick Murphy, ahead by a statistically insignificant 2 points after leading by 5 in August. The poll also found that voters are skeptical of Trump’s recent attempt to draw a line under the Pres. Obama birther controversy.
Among Florida voters likely to participate in November’s presidential election, 46% currently support Clinton and 41% back Trump. Another 6% intend to vote for Libertarian Gary Johnson and 1% support Green Party candidate Jill Stein, with 5% who are undecided. This compares to Monmouth’s August poll which had Clinton at 48%, Trump 39%, Johnson 6%, and Stein 1%.
Clinton has an overwhelming advantage among Hispanic, black and Asian voters who make up about one-third of the electorate, garnering 69% of this group’s vote to 16% for Trump. Her lead among non-white voters was a similar 69% to 19% last month. Trump’s 53% to 35% advantage among white voters is also about where it was last month (51% to 37%).
“Although Clinton’s lead is smaller than in our last poll, she is maintaining her advantage in Florida given the ominous state of her poll standing last week,” said Patrick Murray, director of the independent Monmouth University Polling Institute. He added, “Florida has become less of a crucial battleground now that the campaigns’ attention has turned to the Rust Belt. However, a win here would make the path to 270 electoral votes that much easier for the victor and difficult for the loser.”
Most Florida voters (75%) have heard about Trump’s recent admission that Barack Obama was born in the United States, but they doubt the GOP nominee’s sincerity. Only 24% think that Trump actually believes Obama is a natural born citizen, while the majority (54%) say Trump only made the statement for political reasons.
Trump also implicated Hillary Clinton in starting the birther controversy back in 2008. More Florida voters do not believe she had a role in it (47%) than say she did (35%). While most voters (76%) say this recent flap will have no impact on their vote, 18% say Trump’s statement makes them less likely to vote for him and just 4% say it makes them more likely.
“If Trump wanted to put an end to his role in the birther controversy with his statement on Friday, it does not seem to have had the intended effect,” said Murray.
Florida voters’ opinion of the two candidates has remained stable over the past month. Only 32% have a favorable opinion of Trump and 56% hold an unfavorable view of him. This is similar to his August rating of 33% favorable and 54% unfavorable. Nearly 4-in-10 voters (38%) have a favorable opinion of Clinton and 49% hold an unfavorable view of her. Her rating stood at 36% favorable and 50% unfavorable last month.
Florida voters are divided on who they trust more to handle the issue of illegal immigration, with 47% choosing Clinton and 46% choosing Trump. However, Clinton has the edge on one issue that has dominated the news in Florida. On dealing with public health issues like the Zika virus outbreak, 49% prefer Clinton and 36% trust Trump more.
Turning to the U.S. Senate race, Republican incumbent Marco Rubio currently leads Democratic congressman Patrick Murphy by 47% to 45%, with 3% supporting another candidate and 5% undecided. In a Monmouth poll taken before last month’s party primaries, Rubio held a 48% to 43% edge over Murphy.
Rubio holds a 52% to 42% lead in the more conservative northern portion of the state, as well as a 49% to 41% edge in the central part of the state. However, the challenger actually holds a large 54% to 40% lead in Rubio’s home base of South Florida . [For purposes of this report, regions are defined by congressional district: north = 1-6, central = 7-18, south = 19-27.]
More Florida voters approve (46%) than disapprove (38%) of the job Rubio has done in his term as U.S. Senator, largely unchanged from his 47% approve and 39% disapprove rating last month. However, 37% of Florida voters hold a favorable opinion of Rubio and 36% have an unfavorable view, which is down slightly from his more positive 40% favorable and 33% unfavorable rating in August.
Rubio initially said that he would not run for reelection but changed his mind after ending his presidential bid. Florida voters are somewhat more cynical about his motivations than they were last month. Most say his decision to run for reelection was mainly to improve his chances for a future presidential run – 59% feel this way, which is up from 53% in August. Only 22% say his motivation sprang more from a desire to serve the public, compared to 25% who said the same last month.
“Rubio maintains a lead, but those who had all but written off this seat as a Democratic takeover opportunity may have been premature,” said Murray.
The Democratic challenger remains largely unknown, though. Murphy currently earns a 27% favorable and 13% unfavorable rating, with 59% having no opinion. Last month he had a 22% favorable and 10% unfavorable rating, with 68% who had no opinion.
The Monmouth University Poll was conducted by telephone from September 16 to 19, 2016 with 400 Florida residents likely to vote in the November election. This sample has a margin of error of ± 4.9 percent. The poll was conducted by the Monmouth University Polling Institute in West Long Branch, NJ.
QUESTIONS AND RESULTS
(* Some columns may not add to 100% due to rounding.)
1/2. If the election for President was today, would you vote for Donald Trump the Republican, Hillary Clinton the Democrat, Gary Johnson the Libertarian, or Jill Stein of the Green Party? [IF UNDECIDED: If you had to vote for one of the following candidates at this moment, who do you lean toward – Donald Trump or Hillary Clinton?] [NAMES WERE ROTATED]
| (with leaners) | Sept. 2016 | Aug. 2016 |
| Donald Trump | 41% | 39% |
| Hillary Clinton | 46% | 48% |
| Gary Johnson | 6% | 6% |
| Jill Stein | 1% | 1% |
| (VOL) Other candidate | 1% | <1% |
| (VOL) Undecided | 5% | 5% |
| (n) | (400) | (402) |
3. If the election for U.S. Senate was today, would you vote Marco Rubio the Republican, Patrick Murphy the Democrat, or some other candidate? [IF UNDECIDED: If you had to vote for one of the following candidates at this moment, who do you lean toward – Marco Rubio or Patrick Murphy?] [NAMES WERE ROTATED]
| (with leaners) | Sept. 2016 | Aug. 2016 |
| Marco Rubio | 47% | 48% |
| Patrick Murphy | 45% | 43% |
| Other candidate | 3% | 3% |
| (VOL) Undecided | 5% | 5% |
| (n) | (400) | (402) |
Regardless of who you may support for president…
[QUESTIONS 4 & 5 WERE ROTATED]
4. Is your general impression of Donald Trump favorable or unfavorable, or do you have no opinion of him?
| Sept. 2016 | Aug. 2016 | |
| Favorable | 32% | 33% |
| Unfavorable | 56% | 54% |
| No opinion | 13% | 13% |
| (n) | (400) | (402) |
5. Is your general impression of Hillary Clinton favorable or unfavorable, or do you have no opinion of her?
| Sept. 2016 | Aug. 2016 | |
| Favorable | 38% | 36% |
| Unfavorable | 49% | 50% |
| No opinion | 14% | 14% |
| (n) | (400) | (402) |
[QUESTIONS 6 & 7 WERE ROTATED]
6. Who do you trust more to handle the issue of illegal immigration – Donald Trump or Hillary Clinton? [NAMES WERE ROTATED]
| Sept. 2016 | |
| Trump | 46% |
| Clinton | 47% |
| (VOL) Neither | 5% |
| (VOL) Don’t know | 2% |
| (n) | (400) |
7. Who do you trust more to handle public health issues like the Zika virus – Donald Trump or Hillary Clinton? [NAMES WERE ROTATED]
| Sept. 2016 | |
| Trump | 36% |
| Clinton | 49% |
| (VOL) Neither | 11% |
| (VOL) Don’t know | 3% |
| (n) | (400) |
Turning to the Senate race…
[QUESTIONS 8 & 9 WERE ROTATED]
8. Is your general impression of Marco Rubio favorable or unfavorable, or do you have no opinion of him?
| Sept. 2016 | Aug. 2016 | |
| Favorable | 37% | 40% |
| Unfavorable | 36% | 33% |
| No opinion | 27% | 27% |
| (n) | (400) | (402) |
9. Is your general impression of Patrick Murphy favorable or unfavorable, or do you have no opinion of him?
| Sept. 2016 | Aug. 2016 | |
| Favorable | 27% | 22% |
| Unfavorable | 13% | 10% |
| No opinion | 59% | 68% |
| (n) | (400) | (402) |
10. Do you approve or disapprove of the job Marco Rubio is doing as U.S. senator?
| Sept. 2016 | Aug. 2016 | |
| Approve | 46% | 47% |
| Disapprove | 38% | 39% |
| (VOL) No opinion | 17% | 14% |
| (n) | (400) | (402) |
11. Do you think the reason Marco Rubio decided to run for re-election to the Senate is more to serve the public or more to improve his chances for a future presidential run? [CHOICES WERE ROTATED]
| Sept. 2016 | Aug. 2016 | |
| More to serve the public | 22% | 25% |
| More to improve his chances for a future presidential run | 59% | 53% |
| (VOL) Both | 6% | 8% |
| (VOL) Don’t know | 13% | 14% |
| (n) | (400) | (402) |
[NOTE: Questions 12 through 15 were asked 9/17 to 9/19 and not included in interviews conducted on 9/16; moe ±5.8 ]
12. Have you read or heard about Donald Trump’s recent admission that Barack Obama was definitely born in the United States, or have you not heard about this?
| Sept. 2016 | |
| Yes | 75% |
| No | 24% |
| (VOL) Don’t know | 1% |
| (n) | (286) |
13. Trump had expressed doubt about Obama’s country of birth for a number of years. Do you think Trump really believes Obama was born in the U.S. or did he just say that now for political reasons?
| Sept. 2016 | |
| Really believes | 24% |
| For political reasons | 54% |
| (VOL) Both | 2% |
| (VOL) Don’t know | 20% |
| (n) | (286) |
14. In his statement, Trump also claimed Hillary Clinton and her campaign started the Obama birther controversy during the 2008 election. Do you believe or not believe that Clinton played a part in spreading the Obama birther story?
| Sept. 2016 | |
| Believe | 35% |
| Do not believe | 47% |
| (VOL) Don’t know | 17% |
| (n) | (286) |
15. Does his recent statement on this issue make you more likely or less likely to support Trump, or does it have no impact on your vote?
| Sept. 2016 | |
| More likely | 4% |
| Less likely | 18% |
| No impact | 76% |
| (VOL) Don’t know | 2% |
| (n) | (286) |
METHODOLOGY
The Monmouth University Poll was sponsored and conducted by the Monmouth University Polling Institute from September 16 to 19, 2016 with a random sample of 400 likely Florida voters. Interviews were conducted by a live caller in English, including 350 drawn from a list of registered voters (200 landline / 150 cell phone) and a random digit dial supplement of 50 cell phone interviews. Monmouth is responsible for all aspects of the survey design, data weighting and analysis. The final sample is weighted for age, gender, race and partisanship based on voter list and U.S. Census information. Data collection support provided by Braun Research (field), Aristotle (voter list sample), and SSI (RDD sample). For results based on this sample, one can say with 95% confidence that the error attributable to sampling has a maximum margin of plus or minus 4.9 percentage points (unadjusted for sample design). Sampling error can be larger for sub-groups (see table below). In addition to sampling error, one should bear in mind that question wording and practical difficulties in conducting surveys can introduce error or bias into the findings of opinion polls.
| DEMOGRAPHICS (weighted) |
Self-Reported |
| 32% Republican |
| 34% Independent |
| 35% Democrat |
| 46% Male |
| 54% Female |
| 19% 18-34 |
| 25% 35-49 |
| 28% 50-64 |
| 28% 65+ |
69% White |
13% Black |
15% Hispanic |
4% Other |
Click on pdf file link below for full methodology and results by key demographic groups.