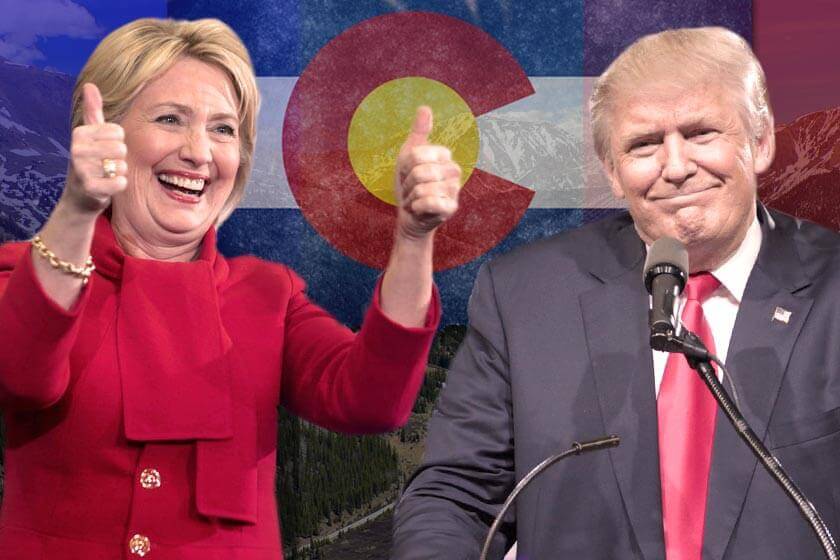
West Long Branch, NJ – Hillary Clinton holds a 13 point lead over Donald Trump in the swing state of Colorado. The Monmouth University Poll also found incumbent U.S. Senator Michael Bennet with an identical 13 point lead over Republican challenger Darryl Glenn in the contest to retain his seat.
Among Colorado voters likely to participate in November’s presidential election, 48% currently support Clinton and 35% back Trump. Another 5% intend to vote for Libertarian Gary Johnson, 3% support Green Party candidate Jill Stein, 3% say they will vote for another candidate, and 7% are undecided.
Among self-identified Democrats, 93% support Clinton while 3% choose Trump, and just 1% back a third party candidate. Trump has less support among his own party base, with 78% of Republicans who back their nominee, compared to 9% who support Clinton, 4% who back Johnson, and 3% who support another candidate. Among independents, 40% are with Clinton and 28% are with Trump, while 10% back Johnson, 5% choose Stein, and 6% support another candidate.
Clinton has a large lead among women voters (56% to 30%) while men are divided – 40% support Trump and 39% support Clinton. Likewise, Clinton enjoys a big edge among voters under 50 years old (51% to 26%) while those age 50 and older are split – 45% support Clinton and 42% support Trump. Clinton also has an overwhelming lead among Hispanic, black and Asian voters (66% to 15%) as well as a slight lead among white voters (44% to 38%).
“Clinton does better among practically every demographic in Colorado than she does nationally. It is way too early to call, but if this dynamic holds, she could end up with the largest electoral margin for a Democrat here since 1964,” said Patrick Murray, director of the independent Monmouth University Polling Institute. Since Lyndon Johnson’s landslide in 1964, Colorado has awarded its electoral voters to the Democrat only three times – in 1992, 2008, and 2012 – with the largest margin being Barack Obama’s nine point victory in 2008.
Colorado voters have a negative view of both major party candidates, but are decidedly more negative toward the Republican. Fewer than 4-in-10 (37%) have a favorable opinion of Clinton while 50% hold an unfavorable view of her. However, only 24% have a favorable opinion of Trump while 64% hold an unfavorable view of him. About 4-in-10 voters (39%) feel it is very important to keep Clinton from being elected president, but a majority (54%) say the same about Trump.
Voters are more likely to say that Clinton rather than Trump is likely to look out for “the little guy” by a 41% to 25% margin. Another 2% say this describes both of them equally while 30% say neither candidate is likely to look out for the little guy. On the other hand, recent news about how Clinton handled her private email server while Secretary of State does not reflect very well on her. Four-in-ten Colorado voters (40%) believe that the Democratic nominee acted criminally, another 33% say she showed poor judgment and just 11% say she did nothing out of the ordinary, with 16% offering no opinion.
Turning to the Senate race, incumbent Michael Bennet currently holds 48% of the likely vote and El Paso County Commissioner Darryl Glenn has 35%. Libertarian Lily Tang Williams has 3% and Green Party candidate Arn Menconi has 2%, while 12% are undecided.
Just over 9-in-10 Democrats (92%) back Bennet while 8-in-10 Republicans (81%) support Glenn. Bennet has a 41% to 28% edge among independents. Bennet (45%) has a slight lead over Glenn (38%) among white voters while black and Asian voters prefer Bennet by a large 61% to 19% margin.
Overall, 51% of Colorado voters approve of the job Bennet has done during his tenure in the U.S. Senate while just 25% disapprove. Another 24% have no opinion about his job performance. On a personal level, 43% have a favorable opinion of Bennet and 21% hold an unfavorable view, with 36% having no opinion. Glenn has a much lower profile, with 20% having a favorable opinion and 10% have an unfavorable opinion of the challenger, while 70% have no opinion.
Glenn, who beat out a number of establishment Republicans for the nomination, has been a vocal supporter of Trump’s presidential campaign. This does not seem to be a factor in his own Senate race at the current time – just 5% say Glenn is too close to Trump and 3% say he is not close enough, while the vast majority (81%) do not view his candidacy in relation to Trump one way or the other.
The Monmouth University Poll was conducted by telephone from July 9 to 12, 2016 with 404 Colorado residents likely to vote in the November election. This sample has a margin of error of ± 4.9 percent. The poll was conducted by the Monmouth University Polling Institute in West Long Branch, NJ.
DATA TABLES
The questions referred to in this release are as follows:
(* Some columns may not add to 100% due to rounding.)
1. If the election for President was today, would you vote for Donald Trump the Republican, Hillary Clinton the Democrat, Gary Johnson the Libertarian, or Jill Stein of the Green Party? [ IF UNDECIDED: If you had to vote for one of the following candidates at this moment, who do you lean toward Donald Trump or Hillary Clinton?] [ NAMES WERE ROTATED ]
| (with leaners) |
July 2016 |
| Donald Trump |
35% |
| Hillary Clinton |
48% |
| Gary Johnson |
5% |
| Jill Stein |
3% |
| (VOL) Other candidate |
3% |
| (VOL) Undecided |
7% |
| (n) |
(404) |
2. If the election for U.S. Senate was today, would you vote for Darryl Glenn the Republican, Michael Bennet the Democrat, Lily Tang Williams the Libertarian, or Arn Menconi of the Green Party? [ IF UNDECIDED : If you had to vote for one of the following candidates at this moment, who do you lean toward – Darryl Glenn or Michael Bennet?] [ NAMES WERE ROTATED ]
| (with leaners) |
July 2016 |
| Darryl Glenn |
35% |
| Michael Bennet |
48% |
| Lily Tang Williams |
3% |
| Arn Menconi |
2% |
| (VOL) Other candidate |
0% |
| (VOL) Undecided |
12% |
| (n) |
(404) |
Regardless of who you may support for president…
[ QUESTIONS 3 & 4 WERE ROTATED ]
3. How important is it to you to make sure that Donald Trump does NOT get elected president – very important, somewhat important, not too important, or not at all important?
|
July 2016 | |
| Very important |
54% |
| Somewhat important |
8% |
| Not too important |
7% |
| Not at all important |
29% |
| (VOL) Don’t know |
2% |
| (n) |
(404) |
4. How important is it to you to make sure that Hillary Clinton does NOT get elected president – very important, somewhat important, not too important, or not at all important?
|
July 2016 | |
| Very important |
39% |
| Somewhat important |
10% |
| Not too important |
6% |
| Not at all important |
43% |
| (VOL) Don’t know |
2% |
| (n) |
(404) |
[ QUESTIONS 5 & 6 WERE ROTATED ]
5. Is your general impression of Donald Trump favorable or unfavorable, or do you have no opinion of him?
|
July 2016 | |
| Favorable |
24% |
| Unfavorable |
64% |
| No opinion |
12% |
| (n) |
(404) |
6. Is your general impression of Hillary Clinton favorable or unfavorable, or do you have no opinion of her?
|
July 2016 | |
| Favorable |
37% |
| Unfavorable |
50% |
| No opinion |
12% |
| (n) |
(404) |
7. Which candidate would do a better job looking out for the little guy – Donald Trump, Hillary Clinton, both of them equally, or neither of them? [ NAMES WERE ROTATED ]
|
July 2016 | |
| Donald Trump |
25% |
| Hillary Clinton |
41% |
| Both of them equally |
2% |
| Neither of them |
30% |
| (VOL) Don’t know |
2% |
| (n) |
(404) |
8. Based on recent news about Hillary Clinton’s use of a personal email server when she was Secretary of State, do you think she committed a crime, she showed poor judgment but did not commit a crime, she did nothing out of the ordinary, or do you have no opinion on this?
|
July 2016 | |
| Committed a crime |
40% |
| Showed poor judgment but did not commit a crime |
33% |
| Did nothing out of the ordinary |
11% |
| No opinion |
16% |
| (n) |
(404) |
Turning to the Senate race…
[ QUESTIONS 9 & 10 WERE ROTATED ]
9. Is your general impression of Darryl Glenn favorable or unfavorable, or do you have no opinion of him?
|
July 2016 | |
| Favorable |
20% |
| Unfavorable |
10% |
| No opinion |
70% |
| (n) |
(404) |
10. Is your general impression of Michael Bennet favorable or unfavorable, or do you have no opinion of him?
|
July 2016 | |
| Favorable |
43% |
| Unfavorable |
21% |
| No opinion |
36% |
| (n) |
(404) |
11. Do you approve or disapprove of the job Michael Bennet is doing as U.S. senator?
|
July 2016 | |
| Approve |
51% |
| Disapprove |
25% |
| (VOL) No opinion |
24% |
| (n) |
(404) |
12. Do you see Darryl Glenn as being too close to Donald Trump, not close enough, or do you not view his candidacy in relation to Trump one way or the other?
|
July 2016 | |
| Too close |
5% |
| Not close enough |
3% |
| Do not view candidacy in relation to Trump |
81% |
| (VOL) Refused |
11% |
| (n) |
(404) |
The Monmouth University Poll was sponsored and conducted by the Monmouth University Polling Institute from July 9 to 12, 2016 with a random sample of 404 likely Colorado voters. Interviews were conducted by a live caller in English, including 350 drawn from a list of registered voters (200 on a landline and 150 on a cell phone) and a random digit dial supplement of 54 cell phone interviews. Monmouth is responsible for all aspects of the survey design, data weighting and analysis. The final sample is weighted for age, gender, race and party registration based on voter list and U.S. Census information. Data collection support provided by Braun Research (field), Aristotle (voter list sample), and SSI (RDD sample). For results based on this sample, one can say with 95% confidence that the error attributable to sampling has a maximum margin of plus or minus 4.9 percentage points (unadjusted for sample design). Sampling error can be larger for sub-groups (see table below). In addition to sampling error, one should bear in mind that question wording and practical difficulties in conducting surveys can introduce error or bias into the findings of opinion polls.
| POLL DEMOGRAPHICS (weighted) | |||
|
Reg Rep 34% | Male 49% | 18-34 25% |
White 83% |
|
Reg Dem 34% | Female 51% | 35-49 25% |
Black 3% |
|
Reg Oth/UNA 32% | 50-64 27% |
Hispanic 11% | |
|
65+ 23% |
Other 2% | ||
| MARGIN OF ERROR | ||||||
| LIKELY VOTERS | GENDER | PARTY SELF-ID | ||||
| Male | Female | Rep | Ind | Dem | ||
| Unweighted N |
404 | 192 | 212 | 130 | 143 |
130 |
| moe |
4.9% | 7.1% | 6.7% | 8.6% | 8.2% |
8.6% |
Click on pdf file link below for full methodology and results by key demographic groups.


